With the seriousness of the situation regards AGW becoming more clear, talk of geo-engineering has increased. I think that rather than try to stem population increase, examine our economic system and expectations, and reduce CO2 emissions, this will be seen as a viable option in the years to come.
However geo-engineering will, I am confident, be used as an excuse to carry on emitting CO2 and avoiding dealing with the fundamental flaw in our civilisation; exponential growth in a finite world. It is dangerous and is a recipe for disaster.
Monday, 17 December 2012
Sunday, 16 December 2012
In the wake of another mass murder...
Advice from a forensic psychiatrist, via Charlie Brooker. Will we ever learn?
Saturday, 15 December 2012
Lake El'gygytgyn and Arctic Warming.
The post on which this is based has been in abeyance since before my recent illness, and resultant blogging hiatus. Due to questions asked in the comments of my previous post I've expanded it and am posting it as an answer to a question about how warm the Arctic has been in the past, and whether this throws light upon the claimed likelihood of an imminent and catastrophic methane blow out.
Sunday, 9 December 2012
Something Wicked This Way Comes.
Probably the best analogue for the current Anthropogenic Global Warming (AGW) is the Paleocene Eocene Thermal Maximum (PETM). How good an analogue is it, and are we really at risk of re-running it? I think we are going to re-run the PETM, not in the sense that we are likely to achieve the same absolute temperatures, although that may be possible, but in the sense that a temperature increase of at least 3degC is achievable from our fossil fuel emissions alone and this will be amplified by methane and carbon dioxide emissions from the Arctic region causing a d13C drop as seen in the PETM. Talk of lowering to 350pm or keeping temperature below 2degC is idle fantasy.
Saturday, 6 October 2012
The Spread of Downwelling IR in models.
In "On the reliability of simulated Arctic sea ice in global climate models" Eisenman et al examine the interplay of infra-red (IR) radiation in GCMS and albedo adjustments used to 'tune' the output of the models to better fit with observations.
Friday, 28 September 2012
Sea Ice Albedo Changes and the Seasonal Cycle.
I'm currently ploughing through my stack of Arctic related papers. It seems to me that in order to fully appreciate the spectacle I think the coming years will deliver, knowing the scientific literature is a pre-requisite. So over the autumn and winter I'll be making more of an effort to post commentaries on what I've been reading. One aspect of the fallout of this year is that there will be a series of papers by various researchers who've been following this year. I can't wait!
However along the way I'll be distracted from my campaign of re-reading and catching up with my 'to be read' folder by research I've not been aware of.
Like these papers...
However along the way I'll be distracted from my campaign of re-reading and catching up with my 'to be read' folder by research I've not been aware of.
Like these papers...
Thursday, 20 September 2012
A Sea Ice Free Arctic by 2020 (and maybe sooner).
I've had this post in varying form for the last three weeks, I've dithered over posting for one reason and another, which has turned out to be for the best. That's because I can start this post with a perfect quote from Dr Julienne Stroeve.
I've been one of what has seemed at times like a minority of one in the amateur community following the loss of Arctic sea ice. My view had been that the ice was transitioning to a new pseudo-equilibrium state, one with an ice pack composed almost entirely of young ice. I now doubt that such a pseudo-equilibrium state exists, and I anticipate a rapid transition by 2020 to a virtually sea ice free state (NSIDC Extent <1M km^2), I suspect it could be much earlier than that.
The acceleration of the loss of the extent of the ice is mostly because the ice has been so thin. This would explain why it has melted so much this year. By June the ice edge had pulled back to where it normally is in September... .
..The 2007 record was set when you had weather conditions which were perfect for melting. This year we didn't have those. It was mixed. So this suggests the ice has got to a point where it's so thin it doesn't matter what the weather is, it's going to melt in the summer. This could become the new normal.Julienne Stroeve.
I've been one of what has seemed at times like a minority of one in the amateur community following the loss of Arctic sea ice. My view had been that the ice was transitioning to a new pseudo-equilibrium state, one with an ice pack composed almost entirely of young ice. I now doubt that such a pseudo-equilibrium state exists, and I anticipate a rapid transition by 2020 to a virtually sea ice free state (NSIDC Extent <1M km^2), I suspect it could be much earlier than that.
Sunday, 16 September 2012
The Early Summer Arctic Dipole.
The two papers introduced in the previous post offer some ideas as to what may be causing this change in atmospheric circulation. I've no doubt we'll see a number of interesting papers getting to the root cause of the shift to repeated early summer Arctic Dipole (AD) pattern since 2007. But what is known at present and what ideas are there about the cause?
Saturday, 15 September 2012
Summer Daze? The Arctic Dipole!
In my last post I updated a post from a year ago entitled Summer Daze in which I showed that a new pattern of sea level pressure anomalies has asserted itself in the wake of the sea ice crash of 2007. New research is out that examines this pattern, sheds some light on possible mechanisms behind it, and considers the implications.
Friday, 7 September 2012
Summer Daze 2012.
Last year I posted "Summer Daze." In that post I detailed a new pattern of atmospheric behaviour centred on high pressure over Greenland, this pattern is new since 2007, and as I showed is a robust change since the 1950s in NCEP/NCAR data.
Well, it's happened again this year...
Well, it's happened again this year...
Tuesday, 4 September 2012
Er, I really can't think of title for this one.
I've had a kickself simple idea about the summer loss of thickness in calculated thickness...
First off. A couple of weeks ago I posted "How Low Can it Go". In a nutshell I pointed out that 2007 and 2011, the previous two records, ground to a near halt in the last week of August, as the sun set on the central polar region. So I suggested that the same would happen this year.
It hasn't.

First off. A couple of weeks ago I posted "How Low Can it Go". In a nutshell I pointed out that 2007 and 2011, the previous two records, ground to a near halt in the last week of August, as the sun set on the central polar region. So I suggested that the same would happen this year.
It hasn't.
Sunday, 2 September 2012
What caused the volume loss in 2010?
I've previously discussed why I see 2010 as a key event in the loss of volume in the Arctic as modelled by PIOMAS, and that there is some indication this has an accompanying impact in satellite observation of sea ice area. But what caused the loss of volume in 2010?
Why the 2010 PIOMAS volume loss was important.
As regular readers of this blog will know, I've been going on about the volume loss of 2010 as an event that rivals 2007 in the PIOMAS model output. Earlier this year Chris Randles asked several people to help him with some PIOMAS data he'd just been made aware of. I was fortunate enough to be one of those people. I'll be posting about how to use the data in excel and posting links to derived graphics and spreadsheets later this week. But for now...
Saturday, 25 August 2012
PIOMAS and Cryosat, an indication.
There has been recent information that allows an indication of how well PIOMAS may be continuing to model sea ice volume. This is based an a couple of figures released from the Cryosat 2 satellite sytem and compared with the earlier, now defunct, ICESat system. The Guardian and BBC have covered this story. From the Guardian Article
Neven managed to get a clarification from Dr Laxon about these figures, here. He said "you may assume that our last data points are for ON11 and FM12. "
Immediately I discount the February/March figures, which the Guardian presumably state as winter, I do this because the PIOMAS domain is much larger than the Cryosat 2 area, so winter figures are not comparable. With regards the October/November figures, as far as I can tell the two systems cover almost the same area of ice at these periods, the peripheral ice outside the Cryosat 2 domain, but within PIOMAS's, is thin this early in the freeze season, so should not add much error due to peripheral seas PIOMAS covers but PIOMAS does not.
So what is the agreement between the two systems? I've calculated the PIOMAS average for the whole of October and November of 2004 and 2011, although the ICESat data window is smaller than this, the Cryosat period is unknown, so it seemed like the most conservative way to compare.
The results are close, it surprised me how close. This can only be taken as indicative, despite the close agreement just two data points are not enough to be satisfyingly sure. Furthermore Dr Laxon has cautioned about the figures for Cryosat 2 being preliminary. However what if we take this evidence as one part of a larger picture.
PIOMAS is well validated against the Submarine thickness data in the Data Release Area, also against ICESat, on which the ON04 figures released by the Crosat 2 team are based. The question remains - Is the recent volume loss an artefact of the PIOMAS model, or is it real?
The denialists try to keep people's attention on single facts, and away from the overall picture, the last thing they want is to have to ackonowledge the volume loss and its implications. The overall picture is that not only does PIOMAS show massive and accelerating volume loss, but so does the US Navy's (pdf). What matters here is that the free running climate models are underestimating change in terms of extent/area, while the assimilating models, PIOMAS and the NPS model, are showing substantial volume loss. PIOMAS is validated against past data and agrees well (Schweiger et al 2011), now we have PIOMAS agreeing well with a peek view of the Cryosat data. ICEsat showed that the volume loss is due to multi-year ice loss (Kwok et al 2008), so does PIOMAS. Furthermore we have three new records for sea ice area in five years, is it significant that two of those records have been in the last two years? Is it a coincidence that these latest records have been in years without weather particularly conducive to ice melt, after PIOMAS has shown, in 2010, the near annihilation of multi-year ice? To claim that all this evidence (and more I'll discuss later) is pointing in the same direction by accident is, to put it bluntly, a load of bollocks.
Kwok et al, 2008, Thinning and volume loss of the Arctic Ocean sea ice cover: 2003–2008.
http://rkwok.jpl.nasa.gov/publications/Kwok.2009.JGR.pdf
Schweiger et al, 2011, Uncertainty in modelled sea ice volume.
http://rkwok.jpl.nasa.gov/publications/Schweiger.2011.JGR.pdf
In winter 2004, the volume of sea ice in the central Arctic was approximately 17,000 cubic kilometres. This winter it was 14,000, according to CryoSat. However, the summer figures provide the real shock. In 2004 there was about 13,000 cubic kilometres of sea ice in the Arctic. In 2012, there is 7,000 cubic kilometres, almost half the figure eight years ago.
Neven managed to get a clarification from Dr Laxon about these figures, here. He said "you may assume that our last data points are for ON11 and FM12. "
Immediately I discount the February/March figures, which the Guardian presumably state as winter, I do this because the PIOMAS domain is much larger than the Cryosat 2 area, so winter figures are not comparable. With regards the October/November figures, as far as I can tell the two systems cover almost the same area of ice at these periods, the peripheral ice outside the Cryosat 2 domain, but within PIOMAS's, is thin this early in the freeze season, so should not add much error due to peripheral seas PIOMAS covers but PIOMAS does not.
So what is the agreement between the two systems? I've calculated the PIOMAS average for the whole of October and November of 2004 and 2011, although the ICESat data window is smaller than this, the Cryosat period is unknown, so it seemed like the most conservative way to compare.
| ON 04 | ON 11 | ||
| PIOMAS | 12.280 | 6.851 | |
| Cryosat 2 | 13.000 | 7.000 |
The results are close, it surprised me how close. This can only be taken as indicative, despite the close agreement just two data points are not enough to be satisfyingly sure. Furthermore Dr Laxon has cautioned about the figures for Cryosat 2 being preliminary. However what if we take this evidence as one part of a larger picture.
PIOMAS is well validated against the Submarine thickness data in the Data Release Area, also against ICESat, on which the ON04 figures released by the Crosat 2 team are based. The question remains - Is the recent volume loss an artefact of the PIOMAS model, or is it real?
The denialists try to keep people's attention on single facts, and away from the overall picture, the last thing they want is to have to ackonowledge the volume loss and its implications. The overall picture is that not only does PIOMAS show massive and accelerating volume loss, but so does the US Navy's (pdf). What matters here is that the free running climate models are underestimating change in terms of extent/area, while the assimilating models, PIOMAS and the NPS model, are showing substantial volume loss. PIOMAS is validated against past data and agrees well (Schweiger et al 2011), now we have PIOMAS agreeing well with a peek view of the Cryosat data. ICEsat showed that the volume loss is due to multi-year ice loss (Kwok et al 2008), so does PIOMAS. Furthermore we have three new records for sea ice area in five years, is it significant that two of those records have been in the last two years? Is it a coincidence that these latest records have been in years without weather particularly conducive to ice melt, after PIOMAS has shown, in 2010, the near annihilation of multi-year ice? To claim that all this evidence (and more I'll discuss later) is pointing in the same direction by accident is, to put it bluntly, a load of bollocks.
Kwok et al, 2008, Thinning and volume loss of the Arctic Ocean sea ice cover: 2003–2008.
http://rkwok.jpl.nasa.gov/publications/Kwok.2009.JGR.pdf
Schweiger et al, 2011, Uncertainty in modelled sea ice volume.
http://rkwok.jpl.nasa.gov/publications/Schweiger.2011.JGR.pdf
Monday, 20 August 2012
How Low Can it Go?
Two weeks ago I published a post that included some predictions about Cryosphere Today's (CT) area index, and the likely minimum. As CT area has just broken the 2011 record, it's probably time to update that post, and to examine a reason why we might not see lows as low as my naive numerical projections suggest.
Sunday, 12 August 2012
Drought again...
Due to events in the Arctic this will be a short post, no need to click 'more', there isn't any more.
Stuart Staniford, on his "Early Warning" blog, has done a typically excellent post on Aiguo Dai's latest paper, the post is here. I've previously blogged on the issue of drought and Hansen's Climate Dice, here and here. Dai's paper is published around the same time as Hansen's Climate Dice new paper is also published, that's discussed here, the actual paper is available here. It's basically a re-run of the Climate Dice whitepaper Hansen released last November, this time peer reviewed and published.
Aiguo Dai's paper, "Increasing Drought under Global Warming in Observations and Models" is available here, that link brings up an html version of the paper for me - no paywall. It revisits earlier work and finds that the lack of drought signature in the US had been due to climatic variability, specifically the Pacific Interdecadal Oscillation, as that impact is now reducing and the warming is continuing, the match between models and observations this century has improved. But rather than me re-produce Stuart's post go read it.
Actually, it strikes me that Al Qaeda have been following the wrong path all along. Instead of suicide bombings, the way to destroy the USA would be to set up an Islamic theocracy somewhere where there's loads of oil, get the US addicted to it by selling it for less than it's really worth, and let the climate system do the hard work. Hang on...
Saturday, 11 August 2012
Some notes on the Early August Cyclone.
It's superfluous to say that there has been a major cyclone in the Arctic during the first week of August. I don't view this as having a pivotal role in whether we see a new record, but I do see it as having a role.

Saturday, 4 August 2012
Further Down the Rabbit Hole
Over at Neven's Sea Ice Blog, in answering a question I had cause to note that the loss of sea ice area between 27 July and the minima had decreased since 2008. Normally I'd not pay too much attention to such small periods, but as the person who'd asked the question noted - I wondered if this was evidence of a negative feedback. If I seem somewhat vague here it's because I can't recall where the conversation occured or who it was with. Anyway I went on one of those enjoyable little trips that Excel and some data can lead me on.
Friday, 3 August 2012
Three Times is Enemy Action...
Once is happenstance.
Twice is coincidence.
Three times is enemy action.
The latest PIOMAS volume figures are in, what they show is what I have expected and backs up what I'm claiming about a significant change to PIOMAS's behaviour. However despite it not being the end of the season we can still see that for 3 years in succession PIOMAS has been behaving 'oddly'.
Sunday, 29 July 2012
Here we go again...
In 2007 the Arctic lost a quarter of it's September minimum area, leading to a new record minimum, this was matched last year. Looking at the state of the Arctic sea ice at present I think we're likely to have another massive loss and soundly break 2007's record. Any earlier in the year and I'd be very sceptical of claims that ice conditions could tell us anything about the state at minima, indeed I have stated my scepticism about the long term impact of thin ice over the Barents Sea during Spring. That thinning was connected to the Pethoukhov/Semenov pattern cold Winter snap in February this year, see here. Yet the ice edge is Barents is now no different from, for example, 2011. But large scale persistent patterns of low concentration this time of year do have an impact on the coming minimum ice state.
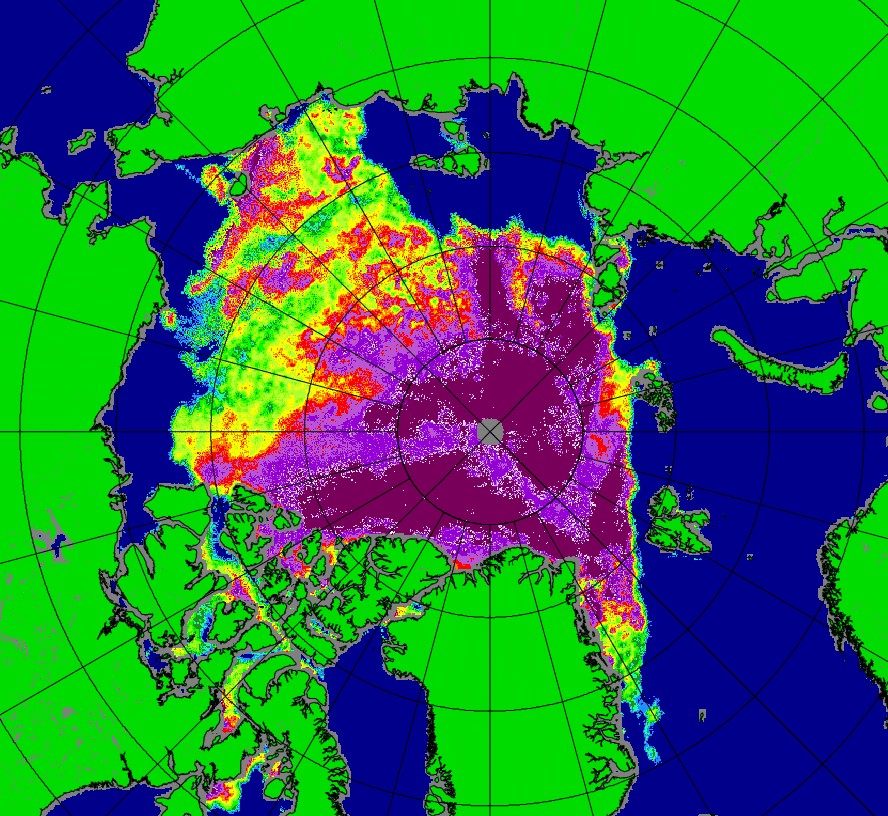
At present much of the area between Beaufort and the Siberian coast is showing very low concentrations. This image is from Bremen's SSMIS site for 27/7/12. This is not just a few days of fleeting low anomaly, it is persistent, and in my view very likely real.

At present much of the area between Beaufort and the Siberian coast is showing very low concentrations. This image is from Bremen's SSMIS site for 27/7/12. This is not just a few days of fleeting low anomaly, it is persistent, and in my view very likely real.
Friday, 6 July 2012
PIOMAS Volume Anomaly June 2012
The PIOMAS June 2012 data is now out, the volume anomaly is shown below, units 1000km^3, baseline period 1980 to 1999.

More commentary over at Neven's, the thickness anomaly gives early indications that the 'roof' has for a third year failed to occur. I'll be posting in due course about the cause of the 2010 Spring volume loss and the reasons for the continuing changed seasonal cycle.
More commentary over at Neven's, the thickness anomaly gives early indications that the 'roof' has for a third year failed to occur. I'll be posting in due course about the cause of the 2010 Spring volume loss and the reasons for the continuing changed seasonal cycle.
Sunday, 24 June 2012
On the difference between knowing and knowing.
I don't just read about the Arctic. On this blog I've touched upon Hansen's findings about temperature extremes and the connection with drought. Elsewhere I've written posts about the intensification of the hydrological cycle. Yes, I've read quite a few papers by scientists like Dai, Syed and Wild on the issue. But this knowledge has remained intellectual, I've known it, but I haven't really known it.
Saturday, 9 June 2012
A Prelude and an Intermission.
I've previously discussed a change to the annual cycle of volume loss, that being an increase in the loss of volume during the Spring, and a following loss of thickness during the Summer. Now the May 2012 PIOMAS figures are in and the early indications of May are that we face a repeat of 2010 and 2011.
The PIOMAS volume anomaly up to day 151 (31 May) is shown below. As with all the work on this blog, the baseline used to calculate the anomaly is from 1980 to 1999, a 20 year period. The PIOMAS volume series is available here.

Figure 1, PIOMAS volume anomaly.
Figure 1, PIOMAS volume anomaly.
Wednesday, 30 May 2012
Transition Complete.
The Arctic is not the same ice pack as it was decades ago, we have now arrived at a state where the ice pack is mainly first year ice.
Tuesday, 8 May 2012
Heatland F**k Up Big Style.
This whole Heartland posters furore bores me. Like the rest of the thrashings of the denialist zombies it's all rather passe. That hasn't stopped me reading other blogs about it. But the best summary I've read so far is from my 'blogroll'. I recommend taking a couple of minutes to read Lazarus: Hitler Liked Dogs. Do You? Basically Heartland have dropped a clanger, even drawing flak from Ross McItrick, Lazarus has some graphics that put things in context.
For those puzzled by the Thatcher billboard mock up over there - Yes Conservative Prime Minister Margaret Thacher, with a background in research chemistry, was one of the first world leaders to really grasp what the climate scientists were saying. She spoke at the Second World Climate Conference, and instituted the Hadley Centre. During that opening she addressed Dr Houghton, head of the IPCC:
For those puzzled by the Thatcher billboard mock up over there - Yes Conservative Prime Minister Margaret Thacher, with a background in research chemistry, was one of the first world leaders to really grasp what the climate scientists were saying. She spoke at the Second World Climate Conference, and instituted the Hadley Centre. During that opening she addressed Dr Houghton, head of the IPCC:
Your Report confirms that greenhouse gases are increasing substantially as a result of Man's activities; that this will warm the Earth's surface, with serious consequences for us all, and that these consequences are capable of prediction. We want to predict them more accurately and that is why we are opening this Centre today.Just goes to prove, people can have right wing viewpoints without losing touch with evidence and reason.
Source.
Thursday, 3 May 2012
CO2 Causes Arctic Sea Ice Loss.
The reason I've not been blogging much recently is because I've been spending time in discussion threads, mainly at RealClimate and Neven's Sea Ice Blog. However news posted at Neven's a recent paper offers the opportunity to make a blog post, and an apology. The paper concerned is "Observations reveal external driver for Arctic sea-ice retreat" by Notz & Marotzke, as usual there's a copy to the actual paper at the end of this post.
Tuesday, 17 April 2012
That mid month miscellanea post again...
Firstly here are two excellent videos from Greenman AKA Peter Sinclair of Climate Crocks. Part 1 and Part 2. As usual I give links to videos as I've still not figured out how to make the Blogger player window large enough for details. The videos are about the recent weird weather and links to the Arctic, there are interviews with a stack of scientists, and clips from the recent Horizon programme on Global Weirding. Total time is only 20 minutes, they really are a must see.
As an aside, it's interesting that the clips from news and TV are from the BBC, yet most of the scientists and meteorologists interviewed are American. I suspect the media in the US aren't serving their audience a diet of reality.
Over at RealClimate there's a post by Axel Schweiger, Ron Lindsay, and Cecilia Bitz on the use of extrapolations of PIOMAS volume, here. The basic message - such extrapolations aren't of much use. I'm of a similar view, I think the comment that sums up my view on extrapolation is "You might as well draw the Arctic’s horoscope."
Over at RealClimate there's a post by Axel Schweiger, Ron Lindsay, and Cecilia Bitz on the use of extrapolations of PIOMAS volume, here. The basic message - such extrapolations aren't of much use. I'm of a similar view, I think the comment that sums up my view on extrapolation is "You might as well draw the Arctic’s horoscope."
Tuesday, 10 April 2012
CO2's role in the end of the Last Glacial
A recent paper by Shakun et al may throw new light upon the role of CO2 in the past glacial and interglacial periods. What does it mean, and does it change the situation we face with regards the current era of anthropogenic global warming, driven in large part by human emissions of CO2?
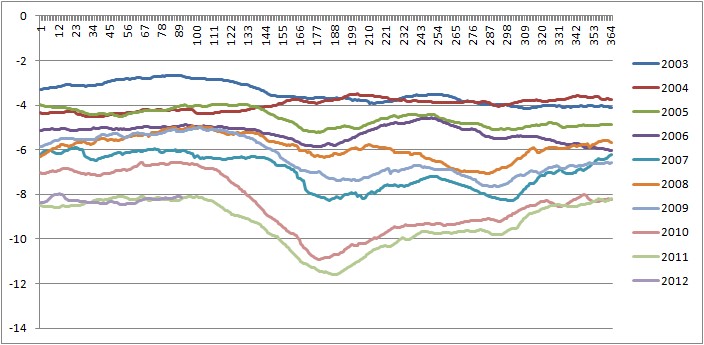
Friday, 6 April 2012
Anticipation...
PIOMAS March volume data is now out, as anticipated the daily anomalies show nothing special with volume tracking close to last year.
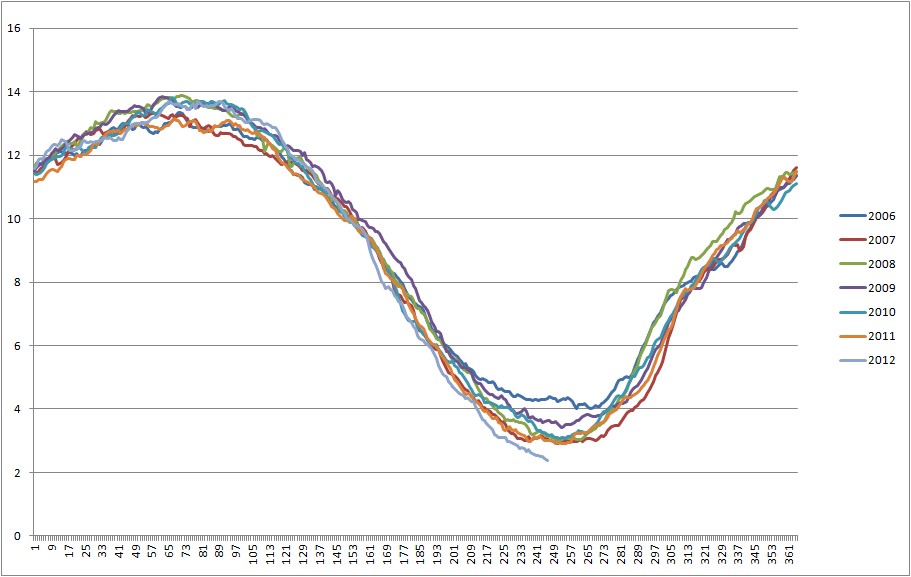
The following graph is of daily volume anomalies, I've calculated the average for each day from 1980 to 1999, the value plotted on the graph is the difference from the average. Click on the graph to see the years, the general trend is down, with 2010 and 2011 showing the greatest drops, 2012 so far being the incomplete purple line.

The first indications of whether we'll see another anomalous volume drop this Spring will come early May when the PIOMAS volume data is out for April. Will see see another drop? If we do, what will that mean?
The first indications of whether we'll see another anomalous volume drop this Spring will come early May when the PIOMAS volume data is out for April. Will see see another drop? If we do, what will that mean?
Once is happenstance. Twice is coincidence. The third time it's enemy action.The anticipation is killing me...
Sunday, 1 April 2012
Musings on Models
In 2006, a year before the massive Arctic Crash of 2007, Marika Holland, Cecilia Bitz, and Bruno Tremblay presented a paper entitled "Future abrupt reductions in the summer Arctic sea ice" to Geophysical Research Letters, it was published later the same year. In that paper (Holland et al) an examination of rapid sea-ice loss periods in models used for the IPCC's Fourth Assesment Report was carried out. Holland et al fnd that a general message from the suite of simulations is that the harder humans force the climate, the faster the sea-ice goes, an observation that for readers of this blog may seem trite.
More interesting, especially in the light of the aftermath of 2007 and the clear failure of IPCC models to reproduce the observed rate of ice loss in the Arctic, is whether the models still tell us something of value about the changes we are seeing in the Arctic.
More interesting, especially in the light of the aftermath of 2007 and the clear failure of IPCC models to reproduce the observed rate of ice loss in the Arctic, is whether the models still tell us something of value about the changes we are seeing in the Arctic.
Saturday, 17 March 2012
Mid March Miscellanea.
This is a filler post with a couple of items mainly because I'm too whacked to write much due to work pressures.
Sunday, 11 March 2012
PIOMAS: Calculated thickness.
This post has been partially re-written as I posted an old version and editing would have made it a mess - I had changed my mind about a main conclusion (it is possible to get figures from calculated thickness that reflect real on the ice thickness) after referring to Schweiger et al and doing some more work on my spreadsheet. The portion that I've ended up editing is between the EDIT statements. I decided to pull the post and re-write as at the time I realised the problem only four people had opened this page. Apologies to those four people.
The calculated thickness is a useful metric, it allows some diagnosis of whether PIOMAS volume changes are due to changes in area or thickness, and changes in its annual cycle reflect changes that PIOMAS volume suggests are significant. But can the calculated thickness metric be used to say anything about real thickness on the ice pack?
The calculated thickness is a useful metric, it allows some diagnosis of whether PIOMAS volume changes are due to changes in area or thickness, and changes in its annual cycle reflect changes that PIOMAS volume suggests are significant. But can the calculated thickness metric be used to say anything about real thickness on the ice pack?
Saturday, 10 March 2012
PIOMAS: The Porch and the Roof.
I've previously discussed why I think Spring 2010 saw an event as significant as the Arctic sea-ice crash of 2007. As a result of my last post and the ensuing discussion I am more confident that Spring 2010 was a significant event and that this year, as with 2011, we will see further massive volume losses in the coming Spring. However there are some details that need to be addressed in this post before I go on to look at whether calculated thickness from PIOMAS and extent/area has any value.
Sunday, 4 March 2012
Cold Winters: From Theory into Practice?
As reported by BBC News this Winter has seen a period of very cold weather over a large swathe of Europe. I didn't blog about this at the time because I was tied up with the issue of methane emissions from the Arctic. However in view of my previous string of posts on cold winters, and the research of Dr Judah Cohen, especially as Dr Cohen's Snow Advance Index didn't predict a cold winter, this recent event needs addressing. Firstly I should stress that this Winter as a whole over Northern Europe hasn't been cold, nor has the continental US, image. Certainly the pattern associated with winters like 2009/10 has not been apparent, which I take as confirmation of Dr Cohen's forecast for this Winter.
There's another reason for this post. Over at Neven's Sea-Ice Blog, Neven said he'd understood the cold event to have been due to easterly winds, he's correct. But that was due to the position of the dominating high pressure system, with Europe on the south of that system winds there were easterly, however from my reading of the event there was also a significant cold outbreak from the Arctic. That being a point Dr Cohen mentioned to me in an email around the time of the event.
There's another reason for this post. Over at Neven's Sea-Ice Blog, Neven said he'd understood the cold event to have been due to easterly winds, he's correct. But that was due to the position of the dominating high pressure system, with Europe on the south of that system winds there were easterly, however from my reading of the event there was also a significant cold outbreak from the Arctic. That being a point Dr Cohen mentioned to me in an email around the time of the event.
Friday, 2 March 2012
What happened in Spring 2010?
There has been an increasing tendency towards loss of volume in Spring, a look at the seasonal changes in sea-ice volume, using PIOMAS for the volume data, shows that the loss of volume in the PIOMAS series is largely accounted for by Spring volume losses. The other event causing loss of sea-ice volume in the PIOMAS series was the 2007 crash in Arctic sea-ice area/extent, the loss of volume in Spring 2010 rivals the loss of 2007.
Saturday, 18 February 2012
AIRS Videos Updates.
I have updated the January and December AIRS videos. From now on the series will be updated regularly, I'll aim to do it each month around the time of release of the latest image, which should be sometime in the second week of the month.
Tuesday, 14 February 2012
Arctic Methane: A Cause for Concern.
In the previous two posts I've outlined why I don't see observed methane release from the East Siberian Shelf (ESAS) to be the start of a fast process of catastrophic release. This is not to say I don't think this is a danger, however I see the danger as being more nuanced than some commentators and bloggers are claiming. Methane emissions from the Arctic region and ESAS may have the power to take our initial perturbation of CO2 emissions (being the largest single anthropogenic forcing, and the anthropogenic forcing with the greatest potential for future increase), amplify that perturbation, and perhaps even take AGW substantially out of our control. While we may not have enough fossil fuel to take us into the high-end IPCC scenarios, methane from the Arctic and the ESAS may just be able to take up the slack as our emissions fall this century due to geological constraints on fossil fuel production.
Monday, 6 February 2012
Arctic Methane: The paleo-perspective.
I've previously gone over some problems I have with the idea that we're on the verge of catastrophic climate change as a result of methane emissions in the Arctic, specifically from the East Siberian Shelf. A further problem I have with the idea of an imminent catastrophic release of CH4 from marine hydrates (or indeed from the Arctic tundra) is the lack of such events during recent paleo-climatic history. The Paleocene-Eocene Thermal Maximum (PETM) is generally cited as the best example of what may happen with regards Arctic methane hydrates and global warming. The parallels are strong, current emissions are occurring at a faster rate than during the PETM (Skeptical Science), and we know that there is a substantial issue regarding methane hydrates in the Arctic Ocean, the East Siberian Arctic Shelf being the largest concentrated store of these.
Thursday, 2 February 2012
Arctic Methane: Imminent, Abrupt and Massive Release?
In April 2008 Natalia Shakhova and colleagues (Shakhova et al 2008) presented data to the European Geosciences Union General Assembly in Vienna about the threat posed by methane clathrates in the East Siberian Arctic Shelf (ESAS). Their abstract read:
When I first read that, the impact was the same as it would be for any reasonable person reading such a statement, coming as it did from people who are acknowledged experts in their field. It was only years later that I finally downloaded and read a copy of David Archer's "Methane hydrate stability and anthropogenic climate change." (Archer 2007) Having just finished reading a stack of papers on Arctic methane I'm still of the opinion that Archer's paper is required reading for anyone interested in this matter, and certainly should be read before people call 'apocalpyse' over Arctic methane. Archer 2007 is a summary paper that concludes that the release of methane is more likely to be a chronic release rather than a catastrophic one.
...we consider release of up to 50 Gt of predicted amount of hydrate storage as highly possible for abrupt release at any time. That may cause ~12-times increase of modern atmospheric methane burden with consequent catastrophic greenhouse warming.Source.
When I first read that, the impact was the same as it would be for any reasonable person reading such a statement, coming as it did from people who are acknowledged experts in their field. It was only years later that I finally downloaded and read a copy of David Archer's "Methane hydrate stability and anthropogenic climate change." (Archer 2007) Having just finished reading a stack of papers on Arctic methane I'm still of the opinion that Archer's paper is required reading for anyone interested in this matter, and certainly should be read before people call 'apocalpyse' over Arctic methane. Archer 2007 is a summary paper that concludes that the release of methane is more likely to be a chronic release rather than a catastrophic one.
Tuesday, 24 January 2012
Dr Jennifer Francis on Arctic weather impacts.
Dr Jennifer Francis recently gave an excellent lecture at the Weather and Climate Summit about the wider impacts of the loss of Arctic sea-ice. I was lucky to see it via the internet last weekend and have waited until now to discuss because the presentation has only just been posted on YouTube. The video is 1:24 long, but is well worth viewing.
Arctic Methane: What can AIRS tell us. Part 2.
This post won't really make much sense unless you've read the original post. It would also help to check out the videos of AIRS methane retrievals that I've previously posted.
Dr Yuragonov was good enough to point to some significant problems with a conclusion I drew in my previous post. In the meantime something else has occurred to me. So this post in essence is intended to add some major caveats to my claimed observations of apparent recurrent small scale anomalies in the AIRS images. The thrust of this will be towards the Laptev Sea anomaly because of it's possible linkage to Semiletov and Shakhova's work in that area. However these caveats also apply to the areas of the Lena River and the Yukon.
Dr Yuragonov was good enough to point to some significant problems with a conclusion I drew in my previous post. In the meantime something else has occurred to me. So this post in essence is intended to add some major caveats to my claimed observations of apparent recurrent small scale anomalies in the AIRS images. The thrust of this will be towards the Laptev Sea anomaly because of it's possible linkage to Semiletov and Shakhova's work in that area. However these caveats also apply to the areas of the Lena River and the Yukon.
Monday, 16 January 2012
Friday, 13 January 2012
Arctic Methane: What can AIRS tell us?
In the last few days I've posted a set of polar view videos of AIRS retrievals of methane. I've been seeing what I can discern from these, so here are a few observations based on them. This isn't the whole story, others might see details I've missed, or be able to correct me. As usual feel free to post comments, I'd also be interested in any links to discussions elsewhere.
Tuesday, 10 January 2012
Arctic Methane: AIRS videos.
NOTE - the source images for these videos have been changed with effect from October 2012. This means I will need to recompile and update all of the videos from scratch. I aim to do this by the end of the month but am unwell at present - so can't do right now.
There's been a flurry of activity on the 'net about methane and the Arctic recently. This seems to be related to the AGU poster by Semilitov & Shakhova and new research from them due for publication this year. The ever-excellent Realclimate have posted two articles by Dr David Archer, here and here. Neven's Sea-Ice blog (also excellent) addresses the issue here.
There's been a flurry of activity on the 'net about methane and the Arctic recently. This seems to be related to the AGU poster by Semilitov & Shakhova and new research from them due for publication this year. The ever-excellent Realclimate have posted two articles by Dr David Archer, here and here. Neven's Sea-Ice blog (also excellent) addresses the issue here.
Subscribe to:
Posts (Atom)