I should first point out that this is all based on PIOMAS, Cryosphere Today's area metric, and a combination of two extent series, IJIS-JAXA and GSFC, provided by Chris Randles (aka Crandles) at Neven's blog. The three data sources are linked to at the end of this post. I'd like to thank Kevin O'Neill for a fruitful discussion following my previous post on this matter
I accept PIOMAS as producing a conservative indications of volume that can at least be relied upon for qualitative argument, the recent volume drops I'm talking about are large enough to be outside of PIOMAS's uncertainty range. So whilst there may be argument about the magnitude, I don't see reason to doubt the qualitative picture of massive and significant losses of volume. PIOMAS does not include parts of the Sea of Okhotsk and the Gulf of St. Lawrence in its model domain, this does not affect the results as here I'm looking at results during the Spring and Summer that are related to daily anomalies (based on daily averages).
So on with the issue of the porch and the roof. I used the term 'porch' to describe a detail in the series of thickness calculated by extent and volume. I used the term 'porch' because of its similarity with an element of composite video signals, figure 5 here. Kevin O'Neill then pointed out that there is a 'roof' in the series of thickness calculated by area and volume, he also argued that the porch was an artefact of the processing technique used to calculate extent. For the uninitiated, extent and area have specific definitions with respect to Arctic sea-ice. Area is calculated as the total of each cell's area multiplied by its sea-ice concentration, the cells are then added up to give total area. Whereas extent is calculated by adding up the area of all cells with over 15% sea-ice concentration. The professionals (e.g. NSIDC) prefer the extent metric because it is a more robust metric that is less subject to issues such as melt ponds, although it can be affected by sea-ice movement. In the past I've preferred sea-ice area, however am quite open to extent. I did my original work using extent because I'd got the IJIS-JAXA dataset as my only daily dataset. Driven by what I've found using extent I've done some more serious searching and now have an area dataset going back to 1979, the same date PIOMAS volume starts from. Because this dataset continues over the winter, whereas IJIS-JAXA doesn't due to the failure of AMSR-E, and because of criticism of extent that I accept, I'll be moving over to using the Cryosphere Today Area series in future.
I agree with Kevin O'Neill that in the porch what we are seeing is an artefact of the processing technique used to calculate extent, however that does not mean there is no value to the observation of the porch, and its recent disappearance. Furthermore the roof is another artefact, this time of the area calculation, as I will show in the following post, the calculation of thickness from PIOMAS volume and area is itself a specific construct that may actually tell us little about real 'on the ground' thicknesses. To understand what the apparent changes mean we must first understand why we are seeing the artefacts, both porch and roof.
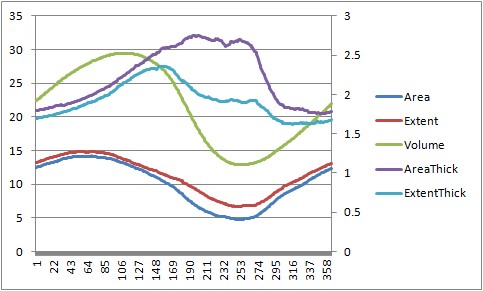
The porch and roof can be seen in the following graph. Bear in mind that as the average over a long period this graph accentuates the features, as will be seen below, each year's roof isn't as tidy a phenomena as in the average.

Here is what I think is happening in that graph: It can be seen that while volume, area and extent all have their maxima in the early part of the year, the maxima for thicknesses are later. Area and extent have their maxima in March, this because the polar night is from September to March and it is during this time that the sea-ice grows. Volume has a later maximum, this is because even while the area and extent are falling as sea-ice recedes from lower latitudes, it is still cold enough over the central Arctic for ice to form and thicken. Thickness based on extent counter-intuitively has its maxima in the late Spring, even more odd is the roof exhibited by area based thickness, which lasts throughout the Summer months. This Spring/Summer peak in thickness is because of the way thickness is calculated, being simply the volume divided by area, or volume divided by extent. The end of the roof and the porch both happen as the sea-ice area/extent reaches its minima and begins to grow, this growth of new thin ice brings down the average thickness. During the Autumn and Winter thickness is at its lowest because there is a large amount of new thinner sea-ice growing in the peripheral seas. Then in the late Winter and early Spring the loss of the thinner peripheral sea-ice causes a growth in average thickness.
Figure 1 is based on the average from 1980 to 1999, calculating the average of all the metrics in that graph for each day gives the series on which the graph is based.
Because the thickness is calculated from the equation:
Thickness = Volume / (Area or Extent)We can interpret any period where volume and area/extent are changing, but thickness is not, as being a condition in which the change in volume is accounted for by the change in area or extent. So for thickness calculated from area, the roof shows that all the way through the Summer the change in volume is largely accounted for by the change in area (roof), and that for thickness calculated from extent, towards the end of the Summer the change in volume is largely accounted for by the change in extent (porch). During both periods change in thickness is not needed to balance the volume and area (or extent). I've broken these periods into decades, using daily averages for each decade.

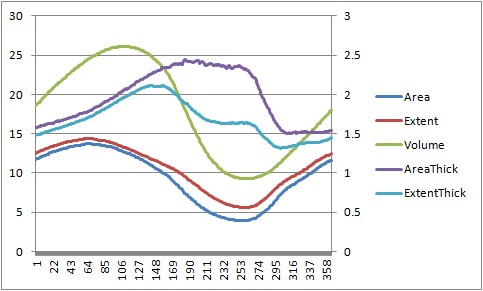
A decade probably isn't long enough to keep a statistician happy, but in terms of the porch, its increasing slope is suggestive of an increasing role of thickness loss throughout the latter two decades. This is borne out by observations on which I've previously posted. Then there are the last two years, 2010 and 2011, the following graph is produced in the same manner as the above four, but averaging over two years.
Again it's reasonable to point out that not only is a two year average not comparable with a ten year, but a two year is even further from statistical significance. However before we leap from that to conclude that nothing odd happened in the last two years, it's worth looking at the longer term context. Furthermore the volume underlying the thickness calculation shows two step drops, one in 2007, the other in 2010, ref.

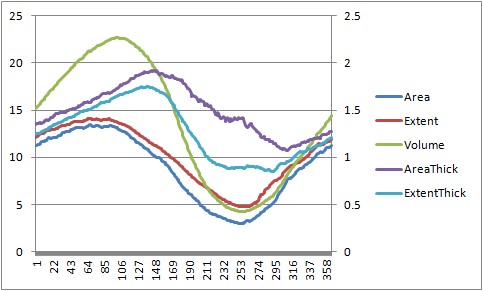
Figure 3, 1979 to 2012 timeseries of calculated thickness using extent and area. Original size here.
The above graph shows that the porch and roof have been persistent features of the extent and area derived thicknesses from 1979, until the last two years. As mentioned earlier, the roof as seen in the average is tidier than for each year alone, however comparing 2010 and 2011 with the preceding years does support the idea of a change to the annual cycle in the last two years. Because the roof and porch are both formed where area or extent changes are able to account for changes in volume without recourse to thickness change, the loss of those features implies that either volume change has increased, extent or area changes have lessened, or a combination of both factors. At present I am unable to tie it down to either volume or area, so conclude it must be a result of changes in both factors.
Another feature is the apparent timing of the minima. The minima have been at around day 365, the very end of one year and start of the next, however since 2007 the minima appear to have been earlier as implied by the rising trend at the end of the year. What has happened here is that whereas in earlier decades the minima has been extended from around day 300, rising shortly before day 365, in recent years the minima has been around day 300 with an immediate rise thereafter. What is the cause of this? Taking the period between day 300 and day 365, area change over that period shows a gradual increase, with a spike to 1000km^2 in 2007, however volume change over that period jumps to a sustained 1000km^3 increase. As thickness = volume/area the sustained increase in volume gain appears to be responsible for the change in the minima.
It is worth pointing out that 2007 does not stand out in the thickness anomalies, whereas 2010 does. This is because 2007's loss of volume was largely accounted for by a loss of extent/area, whereas the volume loss of Spring 2010 wasn't associated with a commensurate decrease in extent/area, implying a loss of volume.
So the calculated thickness metric needs to be treated carefully as it can produce counter-intuitive results, despite that it can be a useful aid to understanding what is going on in the PIOMAS volume series, and what some of the implications are. In my next post I'll look at whether the thickness figures from PIOMAS and area are actually reliable indicators of thickness of the sea-ice.
For references see the following post.
9 comments:
Chris, I posted some numbers over at Neven's following on your PIOMAS comment.
Volume losses in the 2nd half of the melt season have slowed down. This helps explain the disappearance of the roof. I think this might be due to the 'easily' melted ice already gone by late summer. So, in a sense it's due to shifting from the late summer bin to the early summer bin - *BUT* the early summer bin has increased by far more than just this amount.
We're seeing a shift in when ice melts AND an increase in overall melt. This explains both the decreased amplitude of the thickness graph and the disappearance of the porch.
What it does NOT explain is why. I'm still of the initial guess that warmer winters are leaving the ice better prepped for early melt. Now if I can find a decent dataset to plot alongside PIOMAS I can see if there's any actual correlation.
This explains both the decreased amplitude of the thickness graph and the disappearance of the porch.
Should be 'roof' not porch.
Chris, the first clue I've found are the zonal mean Land Ocean Temperature anomalies from GISS incorporating GHCNv3
LOTI Zonal Anomalies for 64N - 90N
Year deg C
2000 1.05
2001 0.98
2002 1.27
2003 1.46
2004 0.7
2005 1.95
2006 1.67
2007 1.97
2008 1.4
2009 1.29
2010 2.11
2011 2.24
We see that 2010/2011 have the two largest anomalies with 2007 just behind. The mean for 1979 to 2011 is .82
Kevin,
"Volume losses in the 2nd half of the melt season have slowed down."
Yes there is a notable decrease in volume anomaly as you go through the Summer, but I'm still unable to rule out area changes as playing a role. Perhaps I'm being overly fussy.
In comments on the previous post you mentioned warm ice. I replied that thinner ice will be warmer because of increased heat flux from ocean to atmosphere. It's a bit too late for calculations on a Saturday night but.
Wikipedia has an entry on thermal conductivity of sea-ice. From which Q = k(Ts-Tw)/h
Q is net heat flux, k is conductivity of ice, Ts is surface temp, Tw water temp, and h is thickness.
From this page FY sea ice has a conductivity of around 2.3 W/m degC.
assume surface temp is -20 ocean is zero, vary h from 2m down to zero in steps of 0.1.
-23.000
-24.211
-25.556
-27.059
-28.750
-30.667
-32.857
-35.385
-38.333
-41.818
-46.000
-51.111
-57.500
-65.714
-76.667
-92.000
-115.000
-153.333
-230.000
-460.000
Because thickness is the denominator decreasing it has a strongly non linear response of the form 1/x. The temperature gradient through the ice will be steeper and while the very surface layer will be -20deg, the bottom layer 0degC, the bulk of the ice will be warmer.
I'm beggining to suspect you're correct - warmer sea-ice melts sooner. However this is such a simple effect that it has to be included in ice physics.
I wonder what result would be from stacking that equation in layers. The specific heat of ice would convert heat flux to temperature I think.
Bloody Hell! that's a serious increase in temperature. Although bear in mind that's an annual average for land & ocean. The ocean increase very likely won't be as much. And as it's an annual average much of it might be in the Autumn and Winter. Is it cause or effect - thinner ice will warm the atmosphere.
That said it does imply warmer ice.
There are some bouy flux and ocean temperature measurements here:
http://www.oc.nps.edu/~stanton/fluxbuoy/deploy/deploy.html
#17 is a long timeseries - no notable change.
Chris, yes there are lots of caveats on the applicability of 64N - 90N temperature anomalies to this problem. That's why I termed it a first clue.
Surface temperatures should suffice, but I really don't want to download the whole gridded database for LOTI, then parse it out for particular latitudinal bands and then map it to exclude land.
The DMI 80N graphs don't help much because 1) we're not sure *where* the PIOMAS volume losses are geographically; and 2) we know the melt season surface temperatures above 80N are constrained to a few tenths around 0C (On this point, if we ignored the physics, we might come to the same conclusion as Steve Goddard; look at DMI, nothing has changed in Arctic summer since 1959!), and 3)DMI's north of 80N graphs ignore most of the area where we observe sea ice area and extent (and possibly volume) losses.
Still, the DMI graphs have been 'texted' (by a skeptic - thru Sept 2009) so I have them in Excel and will see if I can tease anything meaningful from them. My initial look says, "No."
Kevin,
Is the email address on your profile current?
I've got all seasons NCEP/NCAR anomaly plots from 2005 to 2011. Total 28 files and 1.08Mb, I've got them as a zip file which would be more convenient.
Do you have Winzip? Or equivalent.
I can't see an obvious difference between 2010/11 and the rest that would explain the warm anomaly. However both Winter 2011 & 2010 (Jan-Mar) show a clear Warm Arctic Cold Continents configuration, which might add to it.
As I say, I can't find a reason right now but will check them out again and see if anything occurs to me.
Chris, yes the email address is correct.
Have your read Dr Francis' latest paper yet? Short, concise, and clear.
All of this research you've been detailing is presenting a coherent story: arctic sea ice reduction is driving the weather - not the other way around (as skeptics would prefer to have it).
It's the wind!
It's the AO!
It's the NAO!
Ummm, no, it's not. It's a bit more complicated and far more interesting than that. I guess that puzzles me more than anything - the actual science is far more *interesting* than simplistic explanations.
I've a co-worker who spends a lot of time exploring Intelligent Design web-sites. He notes the same thing in the denial of evolution realm - the science is far more interesting than their simplistic explanations. Deniers in any area simply miss out on a lot of fun, interesting research.
No I've not yet read that paper, been busy digging myself out of a hole tonight.
My latest post was FUBAR - I posted an earlier version after a large re-write that changed a major conclusion. When I saved it last night my system glitched, IE restarted and it obviously didn't save the new version.
So I've re posted it and written a large chunk again.
I'll print the Francis paper out and read it on the bus.
Dr Francis also gave me her explanation of why she thinks the Jetstream has a role in the development of the Arctic Dipole, I need to email her again about that because I'm not convinced, which may mean I don't get it.
I'll email you shortly.
Post a Comment