Although I have backed this argument up with my own reasoning based on PIOMAS data, it is not a unique argument, nor is it the first time the factor on which I have concentrated has been noticed. The most beautiful and succinct summary of the process that I have read is made in the paper Armour et al 2010, "Controls on Arctic Sea Ice from First-Year and Multiyear Ice Survivability", PDF.
Given the strong thickness–growth feedback of sea ice (Bitz and Roe 2004), where in a warming climate we can expect the thicker MY ice to thin at a greater rate than the thinner FY ice, and the fact that the ratio of MY to FY ice entering into the MY ice category each year is decreasing, it is likely that the difference between FY and MY ice survival ratios will decrease in a warming climate. If this occurs, the Arctic sea ice system would move toward a regime of decreased memory and decreased sensitivity to climate forcing...This is seen in the PIOMAS Gice sub grid thickness distribution. The volume decline has come from the thickest ice, with thinner ice remaining fairly level, actually on a slight upwards trend.

The volume under 3.3m contains the first year ice and is subject to ice growth by heat flux through it, the volume over 3.3m grows predominantly by slower mechanical processes such as ridging as the ice is crushed by movement of the pack. First year ice can regrow quickly in response to losses, the thicker multi year ice recovers more slowly from losses.
In my original post entitled The Slow Transition, I sketched the outline of an argument that the Arctic Ocean was undergoing an inflection to the long term trend of volume loss. I calculated a back-of-envelope figure for the volume one might expect for an Arctic Ocean thickness of about 2m.
Since 2000 April average area for the Arctic ocean has been around 9.65M km^2 - i.e. this is the nominal area of ice covered ocean at the volume peak. Assume a nominal 2m equilibrium thickness for the FYI, also assume that thinner ice at the Atlantic edge is to some degree offset by the thicker ice in the Central Arctic. 2m * 9.65M km^2 => 0.002km * 9650km^2 = 19.3k km^3. So an April peak volume of around 19.3k km^3 is the nominal volume associated with an Arctic Sea ice nominal thickness of around 2m.I then showed that since 2010 April PIOMAS volume for the Arctic Ocean had levelled at around 19.3k km^3.2011, 2013, and 2014 were within 1% of 19.3k km^3, while 2012 was 2% above that volume. It was pointed out by some that this meant nothing because there have been other localised levellings. However this levelling just happened to occur at around 2m thickness, which is the approximate thickness one would expect for first year ice in April growing from open water in September. Obviously that could just be a coincidence, so I needed to make a stronger argument, and have done so in a series of posts over the last ten months.
In the post entitled Trendsetters, I looked at the dangers of relying on statistical extrapolation of sea ice volume, showing how even with an excellent fit, extrapolation can give the wrong answer.
I then looked at Arctic Ocean Energy Gain, an objection to my original idea had been that the volume loss represented an increase in energy in the Arctic Ocean, and that it seemed impossible that this be slowed down given the background global warming. The answer comes from Armour et al, where they state that "the Arctic sea ice system would move toward a regime of decreased memory and decreased sensitivity to climate forcing". In other words, the increase in autumn/winter volume growth in response to lower volume (or extent) at the September minimum acts against the volume loss, so the apparent energy gain is slowed, with increasing energy being vented to the atmosphere from more open water and thinner ice in the autumn and winter.
This took me on to look at the thickness growth feedback. I showed a simple model of sea ice growth over autumn and winter, then I expressed the model in terms of that feedback. Using that model I was able to explain the autumn winter growth in PIOMAS in the Arctic Ocean, to account for the Central Arctic volume gain, and show that the thickness growth feedback is a powerful negative feedback, that has been active in the past, and has the potential to become even stronger in the years to come.
I went on to outline the monomodal spike of first year ice growth in the Arctic Ocean. As the ice pack has thinned a sharp spike of volume at around 2m thick has developed, I've called this the monomodal spike. Although that blog post was based on PIOMAS grid box effective thickness, the monomodal spike is seen best in the PIOMAS Gice sub grid distribution data.
Looking at the region of Beaufort, Chukchi and the East Siberian Sea, and the Central Arctic I showed how a wall has developed, below which the ice is not thinning as fast as the thicker ice is declining. This is also seen in the wider Arctic Ocean Data, where the Arctic Ocean is Beaufort Sea round to the Greenland Sea, Central Arctic and the Canadian Arctic Archipelago.

The collapse of thicker ice is greater than the collapse of thinner ice, resulting in a wall. The wall is drawn as a fuzzy line because it is due to the thickness growth feedback and thickness over the winter is determined by the cold over winter. However, despite warming over winter in recent decades, ice growth over autumn and winter has increased, so far there is no indication that winter warming is likely to severely limit winter ice growth in the short term. The wall implies that future volume loss rates for peak volume will reduce below the rate seen for the past volume loss, which has come from thick ice.
Whilst writing these posts there has also been a recent important paper in the scientific literature, from Wagner and Eisenman, discussed here. It seems that the simple models that show that show rapid crashes are doing so because of lack of seasonality and latitude in the seasonal cycle, and lack of heat transport response to warming. The more complex GCMs are likely correct in not showing such a behaviour. The heat transport response to warming is a negative feedback not covered in this series of posts, I lack the data to examine it. But in a nutshell it is because heat transport reduces as the temperature gradient between mid latitudes and the Arctic reduces with warming of the Arctic. Wagner and Eisenman conclude that simple physical models "overestimate the likelihood of a sea ice “tipping point”"
During a 2014 Sea Ice Prediction Network seminar, Dr Ed Blanchard Wrigglesworth gave some interesting results from PIOMAS (hat tip to Crandles), around 55 minutes into a Youtube video. The following graphic is taken from the video, so the detail is poor. However the left column shows PIOMAS thickness for recent years as a control, while the right hand column gives the results of the experiment with PIOMAS. The months going down the rows are from June to September.
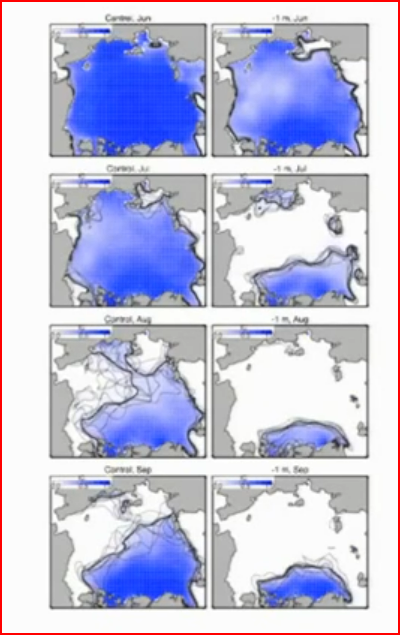
The experiment was to instantly reduce sea ice thickness by 1m over the entire PIOMAS domain at the start of June, I've started calling this the PIOMAS -1m experiment. What was found was that over much of the pack the ice cover collapsed, despite this a residual of sea ice survived for the whole of the summer off the CAA. That residual volume probably amounts to an extent of around 1 million km^2, which makes the state in August and September a virtually ice free state. But that was produced by dropping ice thickness at the start of June by 1m, for thermodynamically thickened ice of around 2m thick that is around a halving of thickness.
Taking into account impacts on winter warming and late season delay to re-freeze, both of which will lead to thinner winter sea ice, this experiment does suggest that whatever winter conditions are needed for a pack 1m thinner than in recent years, the result is a virtually ice free state. So somewhere between current conditions, with winter thermodynamic thickening of about 2m, and a future state of 1m, we will see a very new behaviour of the ice pack emerge. In the spring volume loss of some recent years we may be seeing the start of this process.
What the PIOMAS -1m experiment does suggest the critical importance of April volume for how fast sea ice can be lost in the Arctic Ocean. Note what happens between June and July; halve the thickness and there is enough energy to remove most of the pack, giving a July state worse than any recent September low extent year so far.
The message from this experiment is clear, to get severe summer loss of ice extent and to be left with less than 1 million km^2 by September we need to see a substantial thinning of April thickness. However as I have shown, April 2011 to 2014 shows a four year levelling of volume at around 19k km^3, and this volume is what one would expect for a pack dominated by first year ice with a typical thickness of just under 2m thick (the Central Arctic thickness lifts the average up to 2m). There is a 'wall' in the thickness distribution for April sea ice volume that is arresting the decline of thickness, at around 2m. So I argue that we are seeing an inflection of winter peak volume, the previous rate of decline will relax and April volume will stabilise into a slower rate of decline.
The 2015 volume increase is a problem for me, in that it means I have to wait until volume drops again to see if the following years reveal a new levelling of April volume at around 19k km^3, needless to say, that is what I expect to happen.
The decline in September extent has been driven by the decline in the thickest categories of ice in April, as seen in PIOMAS Gice data and NSIDC Extent. The September extent (purple) tracks the decline in PIOMAS Gice thickness for 3.3m to 28.4m (green). There is substantial variability due to weather, but the overall agreement is good.

As long as there remains sea ice in September this thickest ice cannot drop to zero, this is partly due to transport of ice into the Central Arctic off the northern coast of the Canadian Arctic Archipelago, but even in regions of first year ice dominance, Gice shows a significant volume of ice in the 3.3m to 28.0m category as a result of winter ridging of ice. A scatter plot of this thickest April ice volume and the September extent has a linear trend (R2 = 0.72) that gives 2.65M km^2 extent when the thickest ice volume is zero. So even if the thickest ice declines further it does not imply a collapse in September extent. However as the pack has thinned from loss of thick ice so the amount of open water exposed by spring and summer melt has gone up, which is why September extent has dropped at a faster rate than March extent.
If I am correct that we are at an inflection point in volume loss and that winter peak volume will level at around 19k km^3, then the range of September extents seen since 2007 will become the new normal regime, with a slower rate of September extent and April volume loss as the Arctic winter warms up. It will take many years to see how this will pan out. So having made my case as well as I can, the only thing to do is to leave this subject and see what happens.
23 comments:
Chris,
A couple of thoughts: the quote from Armour et al, "the Arctic sea ice system would move toward a regime of decreased memory and decreased sensitivity to climate forcing" is, as I interpret it, the Tietsche effect. But the analysis in Armour et al is only through 2006. For the most part, recent events in the arctic are excluded.
As I wrote over in the forum, significant changes began happening in 2004 and were dramatized by 2007. And then quickly followed by 2012.
Trying to discern what *changed* is difficult. One of the interesting items I've noticed is that the Greenland Sea average September extent is (post-2007) negatively correlated with all of the other regions. This was not the case prior to 2007:
Region. . Post-2007 Pre-2007
Beaufort -0.5348 -0.0050
Chukchi -0.7217 0.4265
ESS -0.8132 0.2353
Laptev -0.0221 -0.0186
Kara -0.8212 0.0223
Barents -0.2498 0.3475
Central -0.3764 0.4705
CAA -0.6224 -0.0887
The only region that has not changed in relation to the Greenland Sea is the Laptev.
The intuitive explanation is that the ice has become more mobile and in low extent years more of it is ending up in the Greenland Sea. And while the absolute amount remaining in the Greenland Sea in any given year doesn't seem like a large value it probably represents an amount of ice several times larger since the Greenland Sea is essentially a killing ground for ice.
I've only looked at the correlations for September average extent. It might be interesting to see at what time of year this pattern first becomes established.
Kevin,
Those correlations are interesting, volume of ice export through Fram seems fairly level, this might be an issue of the relative importance of export with reduced volume.
Whether ice is thinned by volume lost in melt, or export, the thickness growth feedback still applies as net thickness is decreased.
The Tietsche effect is summed up in their figure 3. Infra red radiation, latent heat, and sensible from open water (or very thin ice) during the autumn increases following the artificial removal of ice. It involves the thickness growth feedback (section 3.1 references Bitz & Roe). However at its core the Tietsche effect is that a removal of sea ice does not persist because of the summer gain in energy being largely vented to the atmosphere in autumn, as the ocean cools with large expanse of open water.
This is distinct from the thickness growth feedback, upon which that statement from Armour et al relies. That feedback only kicks in after the summer heat gain has been vented and the ocean starts to freeze.
The substantial low level atmospheric warming in autumns after the 2007 crash indicates that the Tietsche effect is active. Likewise, the increase in autumn/winter volume gain indicates that the thickness growth feedback is active. Both of these observations, and my calculation of autumn/winter volume growth using the simple model of sea ice growth cover the post 2007 period.
Chris,
I'm not convinced, because you did not account for any effects of changing surface melt timing in spring (snow melt and melt pond formation), which has a very large effect on the ice albedo and seasonal volume loss.
I wonder what would happen if you tried a "PIOMAS accelerated snowmelt experiment" where you simply inserted one week of +2 C near-surface air temperatures, with correspondingly high dew points, from, say, May 20 through May 26, which presumably would be sufficient to melt off the snow, and then let the rest of the season run normally. This would be a more physically plausible scenario (i.e. a big spring heat wave) than a simple instantaneous removal of wither snow OR ice.
Also, the PIOMAS -1m experiment involves the physically unrealistic assumption that such a massive retreat of the ice cover has no effect on atmospheric forcing. In particular, freezing temperatures in early to mid September are occurring in regions where the SST would be several degrees above freezing, forcing an artificially early and accelerated freeze. Having maps for only the monthly averages rather than (say) dividing them into 10-day periods, totally glosses over this since it makes it impossible to see what the ice looks like in early September alone, before the "accelerated freeze effect" becomes too substantial.
Nightvid,
I don't expect you to be convinced.
A paper I didn't include is Mahlstein and Knutti "September Arctic sea ice predicted to disappear near 2 C global warming above present." Noting that GCMs underestimate sea ice loss the authors recalibrate GCM projections using observations and find that sea ice in September disappears at around 2degC global warming, we're currently under 1degC.
This is relevant because the process of spring/summer warming and earlier snow melt should accompany further AGW. But it is wrong to speculate that it will create a rapid crash.
The PIOMAS 1m experiment tells us only one thing: the importance of winter thickness, it is not meant to be a physical projection. Those projections are archived here:
http://psc.apl.washington.edu/zhang/IDAO/predict.html
Note from those images that winter volume fails to fall, but with ongoing global warming the summer volume/extent declines.
And here we turn to the reason for the PIOMAS volume decline. Lindsay & Zhang find that this happened from 1995 onwards due to ice albedo feedback: As the ice thinned it enabled the opening of more open water in summer which got rid of more ice volume (from the thickest ice). Hold winter ice volume/thickness up, with past decline rates reducing and the ice albedo driven decline stalls!
So we're back to Mahlstein & Knutti, because it is the global warming that causes more and earlier spring/summer melt, more ocean warming during summer, delayed refreeze, and the global warming causes more winter warming. All of which gradually lowers peak thickness, leading to the relationship between global warming and sea ice decline, that results in no sea ice at around 2degC. But also does not suggest a rapid crash.
As I do not have a running version of the PIOMAS model I cannot do the experiment you suggest. Perhaps there is another way you could put some more convincing numbers behind your speculation?
With regards your second comment: With a summer of such low extent as seen in the -1m experiment (right column of panels), there would be no re-freeze even in the Central Arctic in September. There would be so much heat in the upper ocean it would significantly delay re-freeze. What you see in September as the monthly average reflects conditions at the end of September, as without the sun that persistent region of surviving ice would not melt significantly.
Mahlstein & Knutti seems like a good starting point, however, I noticed that they frequently relied upon the assumption of linear decline in September area, and this assumption was heavily based on their fits of a dataset that ran for 28 years and ended in 2007. It thus is lacking the all-important last few years in which we have observed large deviations away from the linear decline model.
Furthermore, the only parameter they used to make the case for a linear decline is the goodness-of-fit. This leaves a lot of possibilities out, because it does not constrain the likelihood of alternate fitting functions. You could of course try to invoke a parsimony-based case for the a-priori assumption that linear models should be favored over nonlinear ones; however I would counter that this leaves one with no way to decide between linear models which are parameterized in area and linear models which are parameterized in volume; and furthermore, one could also make an alternate parsimony argument that we should expect the local thickness at any grid point to decline linearly. The only loss of parsimony in this assumption is the fact that we are including spatial variations; however for physical reasons this must be done anyway.
Once the icepack has transitioned to FYI in spring with a thickness near 2m over a very large encompassing region in the Arctic Ocean, the thickness loss (i.e. top melt and bottom melt) needed to melt it is spatially fairly uniform; thus a linear thickness decrease would lead to a sudden crash in either of the two-dimensional metrics of ice cover.
I of course know that you have been arguing in many of your blog posts that the increased spring melt in recent years is indirectly a result of lower spring thickness; however I have not seen a single one of your blog posts which shows that that hypothesis better fits the data than the most plausible alternative hypothesis - which is the hypothesis that the increased spring/summer melt is caused by an earlier onset of the melting of snow, and in fact has little to do with the spring ice thickness.
Thus, I still feel that a lot of physics is being glossed over in a way that is not justified as a decent approximation even based on empirical data.
Nightvid,
That Mahlstein and Knutti stop in 2007 is a problem in relying on that paper. However I do, as you know, also accept the general form of GCM projections of sea ice, that of a tail of persistent ice survival in the summer. And I have referred to Wagner and Eisenman's findings that crashes are a result of deficiencies in the simple models considered.
Assuming I am correct, that winter thickness will decline below 2m thick much slower than the preceding rate of thinning. This then opposes the rapid crash one might expect as the bulk of volume drops into the 2m region (here I am referring to grid box effective thickness). I had seen the winter decline as causing the sort of rapid crash you outline.
http://dosbat.blogspot.co.uk/2013/12/go-on-say-something-outrageous.html
Now I consider I was wrong because I was overlooking the process of winter ice growth.
The PIOMAS spring melt is seen most strongly after the 2010 volume loss event. But last year, with thicker ice in the Central Arctic it was muted.
http://dosbat.blogspot.co.uk/2014/07/mid-july-status.html
I have previously identified much of the PIOMAS spring melt anomaly as coming from the Central Arctic, with additional contribution after 2010 from Beaufort, Chukchi, ESS, Laptev, Kara and the ESS. In one presentation the data suggests 2009 may have been the start in the Central Arctic. Furthermore I have shown that the spring melt is associated with a loss of volume from grid boxes with an effective thickness of 2m to 3m, down to boxes of 1m to 2m grid box effective thickness. Grid boxes over 3m play little role.
Therefore I find it hard to attribute the PIOMAS spring melt anomaly to snow cover, and maintain that the most likely candidate is the volume loss of winter 2010.
PS. Over this month I will be doing the groundwork for revisiting the Spring melt anomaly using gice sub grid thickness data. I will publish in July when I have data on this year's spring melt.
My bet at present: This year will see another muted spring melt.
Chris,
The fact that the >3m grid boxes don't contribute much is not an indication of unrelatedness to snow cover, because those are also the grid boxes with the oldest ice and thickest snow (i.e. the band of ice against the CAA and Greenland). This snow doesn't typically melt completely until late June, which is just at the end of the volume crash on PIOMAS. So you would not *expect* to see an effect there from the albedo loss. However, it does not follow that one shouldn't expect to see this with the rest of the CAB.
When you are trying to test for something being influenced by one variable among many, you have to check for a relation with each variable. You can't simply find that A is linked to B and then assume, with no justification, that it is therefore unrelated to C, because B and C may be highly correlated to each other.
In order to reject the hypothesis that snow loss is the primary driver of ice loss, you need to actually do a statistical test of ice loss vs. snow - if you don't do this, you have simply glossed over the entire issue and are in effect begging the question.
Nightvid,
Surely, as you are claiming snow as the driver the ball is in your court. It is up to you to demonstrate that snow cover is the driver. Up to now you have just been asserting it without hard numbers, or so it seems to me.
The spring volume loss anomaly comes largely from the Central Arctic, and largely from ice volume transferring from 2 to 3m down to 1 to 2m. This fits with the idea of thinner ice post 2010 leading to greater open water formation efficiency.
If we consider snow melt:
Since 2010 at around the start of May the anomalous drop in volume starts. It has started this year as well.
Since 2010 at around the Solstice the anomalies cease to fall and begin to rise. Implying that late summer losses are less than in the past, while May/June volume losses are greater than average.
Has there been a change in weather that leads to warmer weather in May and June?
http://www.esrl.noaa.gov/psd/cgi-bin/data/timeseries/timeseries.pl?ntype=1&var=Air+Temperature&level=2000&lat1=70&lat2=90&lon1=0&lon2=360&iseas=1&mon1=4&mon2=5&iarea=1&typeout=2&Submit=Create+Timeseries
Since 2002 surface temperature north of 70degN has been about -2degC for May/June average. 2005 and 2006 temperatures were between -1 and -1.5degC, 2010 2011 and 2012 was similar. Yet 2005 and 2006 do not show the sort of spring volume anomaly seen after 2010. Note that May this year was the coolest for the same region and dataset since 2001.
2013 and 2014 had cool May/June, between -2 and -2.5degC, yet 2013 had a typical post 2010 spring volume loss anomaly, while in 2014 the volume loss anomaly was muted and with thicker ice after the poor 2013 melt season the spring volume loss anomaly was muted - which happens to coincide with thicker ice.
If snow is the driver, then I need to see a stronger argument that better explains the available data before I will be persuaded.
Chris,
Ok, I agree that the May volume losses in PIOMAS need a different explanation than snow loss, especially for the CAB, since the snow is still dry and white during most of that month. You raise a good point there.
However, the same is not so when it comes to summer. If we look at the second half of June, for example, it's much more plausibly due to snow cover and/or melt ponds - compare the years of high volume loss in the second half of June to the years of high pond coverage (caused by snow melt) seen in Figure 1(b) of Schroeder et al:
http://www.nature.com/nclimate/journal/v4/n5/full/nclimate2203.html
The four big years seen in that figure are 2007 and 2010-2012. These are the same years with high volume loss in the second half of June in the PIOMAS graph. How's that for better correspondence with data?
It would also be interesting to see if this relation holds for the "thinning rate" seen taken over the whole of the months of June and July (i.e. averaged from June 1 to July 31), but you'd need a year-by-year breakdown and plot similar to the "thinning rate" plot from a previous comment:
http://farm3.staticflickr.com/2477/12972928795_8f875bcb77_o.png
Nightvid,
£26 to buy from Nature...
I hate buying from Nature, such prices are outrageous.
Nightvid,
From the Schroeder paper:
"To place our results for melt-ponds in
context we calculated the correlation between the fraction of thin
ice (lowest two ice categories in the model; that is, ice thinner than
1.4 m) with September ice extent using the same integration time
periods. The correlation is strongly significant, but the coe cients
are lower for thin-ice fraction than for pond area fraction using
integration periods up to the end of June (Fig. 3a)."
And 3 a shows R for thin ice fraction starting on 16 May at around -0.7, and continuing until late June where it rises to -0.8.
Whereas for melt pond fraction R value starts at -0.5 on 16 May, rises to -0.8, but drops to below that of thin ice fraction after 30 June.
There is a similarity to May June temperature linked to in my earlier post, in Schroeder's fig b. The problem is that over the same period of warming, since 1995, there has been the decline of MYI. So given the near equal predictive performance of thin ice fraction and melt ponds, I struggle to see how one could extract the relative roles of each. I still don't buy the dominant role of snow idea - you have yet to show how weather plays a controlling role (as either source of or destroyer of snow) in the 2010 to 2012 behaviour of spring melt in PIOMAS. Especially as the PIOMAS -1m experiment shows the same early fast melt behaviour due to thinning (albeit on a larger scale).
SIPN should be out in the next few days, had I to bet, and without my vested interest, I'd bet that Schroeder will be right again this year.
Schroeder is interesting, but given that I get most of my papers for free, £26 is a total rip off.
PS, should have added - I have read that more flat first year ice means more melt ponds other conditions equal. But can't remember where I read that.
I think PIOMAS is fooled by increased sea ice porosity resulting in the ice appearing to be thicker. In fact, there is less actual ice, and the ice is weaker causing it to spread out more, increasing apparent ice extent/volume. Much of what PIOMAS thinks is ice, is actually air in the ice.
The core problem is that we have reached the point where all of Siberia is acting as a solar collector - sending heat to the Arctic sea surface via additional heat in runoff and warmer, moister surface winds. And Arctic fires are burning dusting the sea ice with potash that reduces the ice's melting point and products of incomplete combustion that reduces the albedo where it settles on ice. Thus, the ice is warming, becoming more porous, and weaker.
Increased energy at the margin of the Arctic ocean will drive storms that breakup the ice and mix-up warm, deeper water. As the ice warms, it is weaker and less able to withstand storm energy and remain competent. This is the final feedback loop that will finish the sea ice.
I can not be sure if the big sea ice melt event will come this summer or next summer, but it will be within the next 2 or 3 years, and it will be astonishingly abrupt. Once again, all the big name sea ice guys (except Walham and the guys at the Navy) are going to be ever so surprised.)
Then, within a decade of the big Arctic sea ice melt event, there will be a GIS collapse event and all the guys that were surprised at the sea ice melt event will be be surprised once again.
Aaron
In terms of the equations in the model detailed in Zhang & Rothrock "Modeling Global Sea Ice with a Thickness and Enthalpy Distribution Model in Generalized Curvilinear Coordinates", how does your idea work?
Very interesting charts.
What I would very much like to know is : what happens to the "wall" of ice between 0.5 and 2m of season ice once the "collapse" of ice volume for thickness above 2m hit the "floor" which, in our case would probably be 0?
My guess is : the "wall" start to melt as well, but it just a guess. Maybe we could get a better idea by running the model at constant thickness of 2m and see what happens...
Anyway, long live the Arctics
Hi Eric,
I'm not sure what you mean by the 'floor' hitting zero.
Well, your graphs clearly show that the amount of ice with thickness above 2m is dropping, which you tagged in your graph as the "collapse".
What I meant by "the collapse of ice volume with thickness above 2m" hitting "the floor which in our case is probably 0" is that the volume of ice with thickness above 2m will stop collapsing when it reaches a certain point, which is probably zero or something close to zero.
In other words: after the collapse of ice volume over 2m in thickness, there will come a point where the only ice remaining will be the one between 0,5 and 2m. And when that happens i don't know if the wall you mention will stay steady ...
Right I get you.
The lower edge of the distribution of thickness (the wall) will decrease as the winter warms, it will probably be much later this Century at the earliest before winter ice stops forming (i.e. thickness of 0m), could even be next century. But on the way to that the 'wall' will slowly relax to zero as the winter continues to warm.
Long before that the current process of the 'collapse' will continue. However for as long as there is ice surviving the summer (probably until after 2030 there will be thicker ice formed. Indeed some of the first year ice will ridge and thicken.
So the collapse towards the wall will stall as the 'wall' of winter ice formation stops further loss. Of course although the ice will be somewhat less than 2m, not all of it will be exactly that thick, so there will be a peak with sloping sides, variation of thickness around the average will be present.
In the distant past CO2 was probably about 800ppm when the winter ice didn't form. During the late Paleocene the Arctic Ocean didn't freeze and had deciduous forests along its shores.
Hi, any update ?
Looking at the recent trend, I'm not sure I would as optimistic as you about ice surviving the summer until 2013 (at least in any significant proportion)
No Eric, no update. I'm not really doing sea ice now. Time will tell.
Post a Comment