Sunday 21 April 2013

GISS LOTI and NCEP/NCAR Reanalysis.

In my last blog post (link) I outlined a recent paper that reveals some detail about the structure and cause of Arctic warming, in it I touched upon some concerns with reanalysis. It is notable that NCEP/NCAR doesn't tend to be used in studies of the Arctic, newer reanalysis products such as JRA-25 and ERA seem to be preferred by most researchers. However the reasons for this seem to be in details in literature I've not yet read, I'm not aware of any one paper throwing NCEP/NCAR temperature or pressure outputs into doubt in the Arctic. It would seem that whatever issues there are have not been enough to persuade the PIOMAS team not to use NCEP/NCAR.

But there is one issue I'm aware of; a growing mismatch between NCEP/NCAR reanalysis and GISS Land/Ocean Temperature Index (GISS LOTI).

Saturday 20 April 2013

The Causes of Arctic Amplification.

Arctic Amplification is the term used for the enhanced warming of the Arctic when compared to warming rates for the rest of the globe. While the changes in the Arctic are driven by human activities, as discussed previously, human activities have proven little more than a 'prompting' for a region whose dynamics are driven by powerful feedbacks.

The Arctic is warming, but the pattern of warming over the year, and between surface and aloft is complex, what is causing this warming? In 2012 Screen et al published "Local and remote forcing of observed Arctic warming", PDF in which they used a series of reanalysis data sets and the results of experiments in two climate models to examine the causes of Arctic Amplification.

Tuesday 16 April 2013

Mid April Miscellanea.

The mid month round up of odd bits that interest me and don't fit elsewhere is here. You won't find the 'A' word anywhere in this one.

Wednesday 10 April 2013

PIOMAS: 2013 so far.

Dr Schweiger has been good enough to let me know that thickness fields from PIOMAS gridded data are now available for 2013 up to March. Previously it seems to have been released in January for the previous year. Let's hope they get the chance to update periodically in what I suspect will be an exciting year on the ice.

Monday 8 April 2013

Long Tail or Fast Crash?

As explained in my last post I've been puzzled by the potential implications of autumn/winter ice growth in response to summer area minimums to cause a cessation* to sea ice volume loss. EDIT - not really a cessation, just a reduction in the trend of loss.

As a result I've been playing around with some toy models based on past behaviour, on the principle that whatever factors are to play a role in what is coming, these factors are already at work. The issue here is not the closeness to observation or the PIOMAS model, but the qualitative form of the output and whether that helps say what will happen in the future.

Saturday 6 April 2013

March 2013 Status

March PIOMAS data is out, so it's time to look at the current state of the pack. I've decided to continue these monthly status posts up to September, normally I don't follow the melt season very closely, but this one seems to me to be an important test of my understanding of the mechanisms behind the most recent phase of sea ice loss.

Tuesday 2 April 2013

It's Pin the Tail on the Donkey time.

Neven has published a pole on this years minimum: What will the CT 2013 Arctic SIA minimum be?
CT means Cryosphere Today, and the question at hand is what will the daily minimum be.

Here's a 
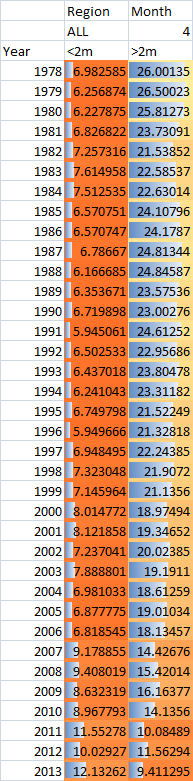
link to the CT Area data. Here's a link to a thread I've written on spreadsheeting this sort of Arctic sea ice data. And if you don't want to build such a spreadsheet yourself then the first line of the top post there gives a link to such a spreadsheet. I'll be updating that at least once a month with the new data, probably more often later in the season if this year's melt season turns out to be as exciting as I anticipate. Feel free to use/modify/whaddeva, as you need - I don't own the data.

Anyway, here's a link to my answer - what I think this year's minimum will be, or at least the range I think it will be in. In a nutshell it's:

I've voted between 1 and 2 M km^2, this is what I see as most likely, if I had a second vote it would be 2.234 to 2 M km^2. But I now rate the probabilities as around 75% and 25% respectively, with a probability distribution peaking between 1.75 and 2, and a slim tail extending down towards 1M km^2.

There's no numerical backup, just a qualitative argument. I just thought it worth recording here so I can keep a check on progress.

No need to click more...

...there is no more. ;)