In the US Navy's HYCOM model there is a persistent, worsening and large region of low concentration ice between the Pole and the Laptev Sea, is it real?
Saturday, 29 June 2013
Sunday, 9 June 2013
June Cliff Watch
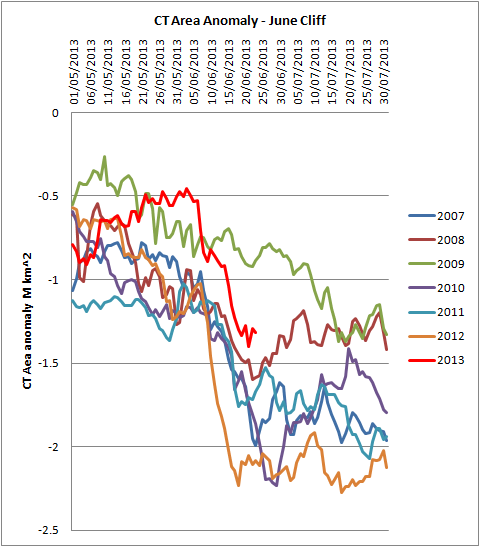
In an earlier post I outlined the June Crash, link, or as I'll now call it in line with others, the June Cliff. It's now happening. Below is a graph of CT Area anomalies (differences from the average seasonal cycle). This will be updated regularly throughout June on this page.
2013 joins 2007, 2010, 2011 and 2012 in having a June Cliff. I'm pretty sure that 2013's June Cliff has now ended, it lasted from 6 June to 18 June. My next post on the Arctic sea ice will be the June Status post, when the PIOMAS data is out, this post will not be updated further.
As mentioned in my previous post, and discussed in the earlier post on the June Cliff (Crash) much of this drop in CT Area is not real loss of area but is due to melt ponding on the ice. This does not mean it has no impact on real area because melt ponds lower the albedo of the surface and absorb more sunlight.
While I now doubt we will see a new record this year, I expect a very exciting season. As with the May Status posts, I expect the June Status to take up more than one post.
Data as of 23/6/13.
In the figures below, Daily is the difference between successive days, Difference is the difference between area on that date and on the same date in 2012.
Date Area Daily Difference
01/6 10.656 -0.035 0.716
02/6 10.581 -0.075 0.703
03/6 10.498 -0.084 0.715
04/6 10.382 -0.116 0.601
05/6 10.291 -0.091 0.535
06/6 10.223 -0.068 0.505
07/6 09.976 -0.247 0.314
08/6 09.815 -0.161 0.301
09/6 09.710 -0.105 0.369
10/6 09.714 +0.004 0.639
11/6 09.617 -0.097 0.775
2013 joins 2007, 2010, 2011 and 2012 in having a June Cliff. I'm pretty sure that 2013's June Cliff has now ended, it lasted from 6 June to 18 June. My next post on the Arctic sea ice will be the June Status post, when the PIOMAS data is out, this post will not be updated further.
As mentioned in my previous post, and discussed in the earlier post on the June Cliff (Crash) much of this drop in CT Area is not real loss of area but is due to melt ponding on the ice. This does not mean it has no impact on real area because melt ponds lower the albedo of the surface and absorb more sunlight.
While I now doubt we will see a new record this year, I expect a very exciting season. As with the May Status posts, I expect the June Status to take up more than one post.
Data as of 23/6/13.
Date Area Daily Difference
01/6 10.656 -0.035 0.716
02/6 10.581 -0.075 0.703
03/6 10.498 -0.084 0.715
04/6 10.382 -0.116 0.601
05/6 10.291 -0.091 0.535
06/6 10.223 -0.068 0.505
07/6 09.976 -0.247 0.314
08/6 09.815 -0.161 0.301
09/6 09.710 -0.105 0.369
10/6 09.714 +0.004 0.639
11/6 09.617 -0.097 0.775
12/6 09.535 -0.081 0.851
13/6 09.452 -0.083 0.898
14/6 09.384 -0.068 0.974
15/6 09.191 -0.193 0.987
16/6 08.992 -0.199 0.962
17/6 08.865 -0.127 0.918
18/6 08.722 -0.143 0.933
19/6 08.595 -0.127 0.749
20/6 08.597 +0.002 0.826
21/6 08.389 -0.208 0.651
22/6 08.403 +0.014 0.816
23/6 08.272 -0.131 0.768
Source data from Cryosphere Today, link.
Saturday, 8 June 2013
May 2013 Status: Part 3, New Gridded PIOMAS Data.
Gridded PIOMAS thickness data has just been released for April and May, hat-tip to Wipneus for announcing it, and as always to the PIOMAS team for doing the extra work of releasing this data pro-bono. The US Navy's HYCOM system is good for day-to-day work, but with monthly data going back until 1978 and a numerical data source, nothing beats PIOMAS as a proxy for Arctic sea ice volume.
Wednesday, 5 June 2013
May 2013 Status: Part 2, Prospects for the 2013 Minimum.
PIOMAS Main Series data is now out, I use that term to differentiate from the gridded dataset I also use on this blog. In view of this (as you'll see) and the Cryosphere Today (CT) Area index I can't help but wonder if this year will not even match 2012's record, let alone give a new record. As Neven has recently noted this year has been a slow start, link. Is it going to be delayed enough to scupper any chance of a new record in CT Area minimum this year?
Monday, 3 June 2013
The Sine Qua Non of FUBAR.
In my previous post I presented a blink comparison of image R04C04 from the MODIS Arctic Mosaic, link. Hovering the mouse brings up the image ID, which is right of centre, and clicking on the image gives a larger image. Image R04C04 is in the region of low concentration shown in the US Navy's HYCOM model as a result of the recent May storm.
I've used the highest resolution, 250m per pixcel, and stacked a series of images in an image editor, then used crop to select a single region to show ice conditions since 2009 over the exact same region of the pack for the same day of the year (with dither to avoid cloud white-outs), and the 2013 state before the May Storm. I have then turned each image into a negative in order to bring out the water between ice floes, even under cloud. No other manipulation has been done, all images are in original resolution. The ice shows up dark, water between floes as white striations.
The animated gif is available in my Google Docs account, this link should bring up the viewer, which is excellent for large images. The image is too large to post on the blog itself. LINK.
Sunday, 2 June 2013
May 2013 Status part 1: The May Storm
May's status blog post will be in two parts. This first part will deal with the May Storm which has had such a striking impact on the ice pack to the Siberian side of the Pole.
Subscribe to:
Posts (Atom)