More interesting, especially in the light of the aftermath of 2007 and the clear failure of IPCC models to reproduce the observed rate of ice loss in the Arctic, is whether the models still tell us something of value about the changes we are seeing in the Arctic.
Holland et al note that over an example model run there are significant abrupt drops in March sea-ice thickness, implying drops in overall sea-ice volume. They point out that similar drops occur earlier in the model run and are not associated with drops in extent. however the drop in question in model run 1 happens at a time when sea-ice has already been substantially thinned.

Figure 1. Figure 1 of Holland et al. Sea ice extent timeseries of model run 1.

Figure 2. Figure 2 of Holland et al. Average March sea ice thickness timeseries of model run 1.
It is worth pointing out here that March PIOMAS volume shows no such drop in recent years, the greatest drops are after March in the Spring. Whether or not these Spring drops have greater significance than volume drop in and of itself is, as far as I can see, an open question at present. However the models show a role for ocean heat fluxes that is reminiscent of the 2007 event. Again, to quote Holland et al:
Over the 20th and 21st centuries, this heat transport exhibits a gradual upward trend overlaid by periods of rapid increase (Figure 3a). These rapid "pulse-like" events lead changes in the sea ice by 1–2 years, which is evident from the timeseries of detrended heat transport and detrended ice thickness (Figure 3b).Looking back to the Crash of 2007 there appear to be parallels here. Smedsrud et al note that between 2001 and 2004 ocean heat flux through the Bering Strait likely doubled from ~4 TW to 9 TW, this influx of warm water being of such a salinity that it likely stayed close to the surface. In the Atlantic sector an increase through the Fram Strait occurred from 130 TW to 200 TW, although this inflow occurred at around 100 to 400m depth and likely stayed that deep unless processes mixed it upwards. But the qualitative similarity remains compelling; in the models pulses of warm water lead (possibly cause) reductions in the sea ice extent by 1 to 2 years, and in reality increases of ocean heat flux preceded the losses of 2007 by 1 to 3 years.
The major drivers behind 2007 were the clear skies and high pressure associated with an extreme positive Arctic Dipole anomaly event. As I have blogged previously (here and here), the Arctic dipole is a response to the loss of sea-ice, and is a factor acting against sea-ice, making it a feedback due to AGW. So does this mean that 2007 wasn't like the modelled sea-ice loss events?
Schweiger et al, Zhang et al (a & b) and Perovitch et al support the following broad picture of the processes leading to the losses of 2007: An influx of warm waters through the Bering Strait, driven by the extreme positive Arctic Dipole delivered enough heat to melt 0.5m of ice over the Chucki Sea. That influx of warm waters can itself be attributed to the Arctic Dipole, as the meridional wind anomalies that characterise it are able to draw water in through the Bering Strait (+ve phase) or the Atlantic (-ve phase). The Arctic Dipole also hastened the transpolar drift, transporting large amounts of ice over the Arctic and increasing build up off Canada and transport through the Fram Strait, this lead to the formation of open water in the Pacific sector of the Arctic. This resultant open water, under clear skies, allowed the ice albedo effect to increase absorbed solar radiation by 500%. Schweiger et al find that insolation during June and July did not drive the sea-ice recession at that time, although it did casue thinning of the ice, Perovitch's study of mass balance buoys finds that insolation (the 500% figure) did cause subsequent warming from August onwards due to open water. As Schweiger et al note "local heating in response to the removal of sea ice is the more likely reason for the increase in temperature" [south of the ice edge].
However it is not quite as simple as this because the Arctic Dipole itself was both cause and effect. Bluthgen et al use a model forced with observed sea surface temperatures and ice concentrations to study the atmospheric situation in 2007. They find that the initial atmospheric pattern leading to ice loss is reinforced both regionally and due to ice-export acting to intensify the ice loss. So this pattern, the Arctic Dipole, was itself intensified by the sea-ice loss it caused.
So within this picture how does the observed increase in ocean heat transport preceding the event fit in? It seems to me that it may have had a role in preconditioning, and from the findings of Bluthgen may have been the initial cause of the anomalous weather that caused the losses of 2007. The Arctic Dipole anomaly has been observed in a model by Watanabe et al, Bluthgen also find it in a different model. But does the Arctic Dipole play a role in Holland et al's findings of modelled sea-ice drops? I don't know.
Boe et al find that the main reason for the spread of response to anthropogenic forcing in models is because most models overestimate the strength of the inversion over the Arctic. The Arctic atmosphere has been typified by an inversion, whereas normally temperature decreases with height, in an inversion temperature increases with height causing a 'pool' of cold air to sit on the surface insulating the surface from warmer airflows which are deflected over the inversion. The inversion is caused because the Arctic is able to lose heat by radiation, cooling the surface. The longwave feedback referred to in Boe et al is the emission of infra-red radiation allowing the ocean to lose large quantities of heat during the Autumn and Winter. Any model overestimating the cold over the sea-ice would in turn overestimate the thickness of the ice because the ice grows from the base due to heat flux through the ice, and the heat flux is dependent on the temperature gradient between underlying ocean and the atmosphere above. Hence models suffering from this bias would overestimate the thickness ice would grow to in the winter as well as overestimating the cooling of the ocean.
An interesting aside from Boe et al is that in the course of narrowing down the 'culprit' behind the model spread they confirm earlier work by Soden et al: They show that over the Arctic the increased greenhouse effect due to increased water vapour is substantially overwhelmed by infra-red loss due to the warmer atmosphere.
However are there really a small set of resolvable reasons why the models are under-performing? Or could the reasons be less specific? Looking at the models Boe et al used, and those selected by Wang & Overland (below), there is no clear pattern that may help resolve this matter. This is the sort of problem I've seen noted elsewhere that there seems to be reasons for each model, although Boe et al seem to me to have found one issue common to many GCMs.
As a post-scriptum - Over at Stoat Steve Bloom has raised the issue of Mahlstein and Knutti (M&K) 2011, which is in the references of this post. The paper doesn't really address the whole Arctic representation in GCMs in the way that Boe et al has widespread impact, M&K mainly has impacts in the Barents Sea due to lack of realistic Atlantic ocean heat transport. That's of clear importance for Europeans, as I've posted recently, this winter we have seen a cold weather event that seems to be due to ow sea-ice in the Barents and Kara Seas. It is also worth noting that M&K state "Those models that transport more energy to the Arctic show a stronger future warming, in the Arctic as well as globally. Larger heat transport to the Arctic, in particular in the Barents Sea, reduces the sea ice cover in this area. More radiation is then absorbed during summer months and is radiated back to the atmosphere in winter months.This process leads to an increase in the surface temperature and therefore to a stronger polar amplification. The models that show a larger global warming agree better with the observed sea ice extent in the Arctic. In general, these models also have a higher spatial resolution." The former point agreeing with scepticism as to model performance in the Arctic, the latter with the arguments of Maslowski (see below). I've not gone into that paper in detail at present, I may do in future, for the time being there's a copy linked to in the references.
Wang & Overland approach the problem of model under-projection from a different angle, inspired by an earlier paper by Knutti et al (2006). They use the seasonal cycle of sea-ice as a forced response to external forcing, in this case changes of incident solar radiation, and reason that the models that perform well on that metric will probably out-perform the set of available models when it comes to another externally imposed forcing - that of anthropogenic forcing. Wang & Overland select six models that provide the best seasonal cycle, they use the criteria of extent less than 1 million km^2 instead of zero as a reasonable target for 'nearly sea-ice free' and find that their selected models give a mean 'nearly sea-ice free' date of 2037. This stands against rejected models giving dates after 2050.

Figure 3. Figure 1 of Wang & Overland. The six models chosen as best reproducing the seasonal cycle. Red trace is observations, blue and pink are model runs. Grey traces are runs done without anthropogenic forcings.
While not a General Circulation Model, PIOMAS seems to be the most accurate model of Arctic sea-ice that is backed up by a publicly available set of published research. Other may claim Maslowski is better, I've had problems finding the sort of open detailed background in the literature that PIOMAS is backed by, this may be because of security issue w.r.t. the US Navy: But it means I discounted his work a while ago, if I can't check the evidence I'm not minded to take things on faith. PIOMAS works by assimilating NCEP/NCAR reanalysis atmospheric data as it's atmosphere. The publicly available PIOMAS volume series is from a run that also assimilates sea-ice concentration and sea surface temperature. From then it is a model of the ocean and sea-ice, so it effectively gives the response of the sea-ice to the variables it assimilates.
Zhang et al 2010 use PIOMAS to make projections. They use GCM projections of Arctic temperature to provide a 'backbone' of forcing for the projection. To address the problem of natural variability they use NCEP/NCAR reanalysis to provide years of weather and apply these randomly to the projection of future Arctic temperature using this, instead of contemporary data, to drive PIOMAS. The authors note in their paper that applying past years of weather to a future projection means any trends in weather that may be exacerbating sea-ice loss will not be represented by the technique they use. I raise this issue specifically in respect of the Arctic Dipole.
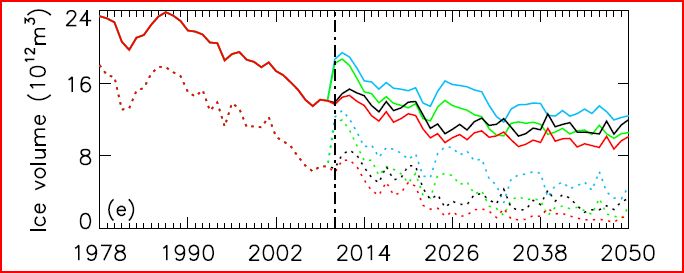
Figure 4. Figure 3 of Zhang et al 2010. Dotted lines are September volume, solid lines are annual volume. Red up to 2009 is PIOMAS volume using NCEP/NCAR reanalysis for the time up to 2009. Coloured lines after 2010 are projections using random years of NCEP/NCAR reanalysis and scenarios A1, B1, A2 & B2.
The inflection point around 2009/10 is also seen in surface air temperature, and downward longwave radiation. There is a step drop in ice growth and melt. The latter two cases are to expected when merging model projections with PIOMAS runs forced by the observed weather. However in terms of the inflection (change in trend) this seems to be important, it's also worth noting here that the recent losses in Spring 2010 and 2011 are not considered, as the study was completed before these events happened. The results of this projection using PIOMAS is that the Arctic is not expected to be seasonally sea-ice free until after 2040. A major reason the authors state for the modelled drop off in loss rate as the minimum extent drops is that while Summer melt continues to increase as temperatures increase, Winter growth of ice increases, almost commensurately, due to thinner ice losing more heat to the atmosphere. It's worth here restating that Boe et al find that over the Arctic the increased greenhouse effect due to increased water vapour is substantially overwhelmed by infra-red loss due to the warmer atmosphere. This is essentially the Tietsche effect, but we don't have to wait for the future to see it, this loss of heat warming the atmosphere is responsible for the Arctic Amplification being seen in Autumn and Winter. Just a side note here - William Connelly pointed out to me that he was a co-author on a paper upon which Tietsche et al based their study. I am however using the term 'Tietsche effect' because it was in the Tietsche paper that the mechanisms were exposed.
This might explain an apparent conundrum. PIOMAS when forced with NCEP/NCAR reanalysis seems to be producing a rapid loss of volume, a loss that does not at the face of it seem congruent with the PIOMAS projection of significant sea-ice persisting beyond 2030. PIOMAS is forced by NCEP/NCAR; 10m surface winds, 2m surface air temperature, specific humidity, and downwelling radiation amongst other factors. Shortwave flux is calculated using NCEP/NCAR cloud fraction. Crucially when Boe et al compared the inversion in NCEP/NCAR with AIRS satellite observations they found that the reanalysis does not suffer from the same overly strong inversion problem that most of the models considered do. So PIOMAS's current operation is being done using a configuration that is not subject to the same problem as Boe et al found. So perhaps this is part of the reason for the long survival of sea-ice in the projections of Zhang et al 2010 - as the spine of the temperature increase, upon which the natural variability of NCEP/NCAR hangs, is due to models that suffer from the Boe effect, whereas NCEP/NCAR reanalysis does not.
Combine this introduction of the Boe effect by using GCM projections with the impact of shuffling years of NCEP/NCAR data having the effect of neglecting the impact of what Overland has called "recent radical shifts" in Arctic circulation (the Arctic dipole), and perhaps we are nearing an explanation of why current PIOMAS volume decrease is suggesting a rapid and apparently terminal accelerating decline of volume, whereas the PIOMAS future projection does not support this. However against this must be considered the increasing Winter sea-ice growth opposing increasing Summer melt, which seems to be a fairly basic outcome of the Zhang et al projection and PIOMAS's model physics.
So word of the Arctic's imminent demise may be somewhat premature, even if the models that project a sea ice free state in the third or fourth quarter of this century are looking increasingly unbelievable.
Bluthgen et al, 2011, "Atmospheric response to the extreme Arctic sea ice conditions in 2007." http://www.agu.org/pubs/crossref/2012/2011GL050486.shtml
Boe et al, 2009, "Current GCMs’ Unrealistic Negative Feedback in the Arctic." http://www.atmos.ucla.edu/csrl/publications/Hall/boe_et_al_published.pdf
Holland et al, 2006, "Future abrupt reductions in the summer Arctic sea ice."
http://shadow.eas.gatech.edu/~kcobb/abrupt/holland06.pdf
Mahlstein & Knutti, 2010, "Ocean Heat Transport as a Cause for Model Uncertainty in Projected Arctic Warming."
http://www.iac.ethz.ch/people/knuttir/papers/mahlstein11jc.pdf
Perovitch et al, 2008, "Sunlight, water, and ice: Extreme Arctic sea ice melt during the summer of 2007."
http://imb.crrel.usace.army.mil/pdfs/2008GL034007_for_IMB_web_page.pdf
Smedsrud et al, 2008, "Recent and Future changes of the Arctic sea-ice cover."
ftp://ftp.nersc.no/Press/Smedsrud08.pdf
Wang & Overland, 2009, "A sea ice free summer Arctic within 30 years?"
http://archive.mrc.org/pdf/WANG-OVERLAND-ARCTIC%20SEA%20ICE%20ESTIMATE.pdf
Schweiger et al, 2008, "Did unusually sunny skies help drive the record sea ice minimum of 2007?"
http://psc.apl.washington.edu/zhang/Pubs/Schweiger2008GL033463.pdf
Watanabe et al, 2006, "Arctic dipole anomaly and its contribution to sea ice export from the Arctic Ocean in the 20th century."
http://www.geocities.co.jp/ejnabe_arctic/archive/GRL06.pdf
Zhang et al a, 2008, "The role of Pacific water in the dramatic retreat of arctic sea ice during summer 2007."
Zhang et al b, 2008, "What drove the dramatic retreat of arctic sea ice during summer 2007?"
http://psc.apl.washington.edu/zhang/Pubs/Zhang_etal2008GL034005.pdf
Zhang et al, 2010, "Arctic sea ice response to atmospheric forcings with varying levels of anthropogenic warming and climate variability."
http://psc.apl.washington.edu/zhang/Pubs/Zhang_etal_2010GL044988.pdf
3 comments:
Chris, when would you think demise of the Arctic could occur?
Do you think that particular tipping has already been reached, and it is still only a matter of waiting for the current climate to stabilise?
It's hard for me to look at the PIOMAS trend and not expect the Arctic to be considered ice free in summer by the end of this decade.
Hello again Lazarus,
I don't know when the Artic will be seasonally sea-ice free. I've said over at Stoat that I'm not minded to argue against this decade given PIOMAS. However formally I'm still sticking to later next decade at present.
It's not the PIOMAS trend per se that might change my mind. The PIOMAS model when used to project suggests an increase in first year sea-ice growth that partially compensates for the losses. This would suggest that whilst we're seeing large volume losses at present they should reduce as time moves on. So massive losses don't persuade me of the 'early' argument, and certainly naieve extrapolation is something I find very unpersuasive. What's really got me thinking is that, as I've shown, most of the recent acceleration in PIOMAS loss is in Spring. I'm waiting until this Spring's data are in before saying anything public on this matter.
Tim Lenton argues that 2007 was a tipping point, he argues that the increase in seasonal cycle shows that something has changed. Graphing the annual range (max - min for same year) doesn't persuade me that a threshold has been passed in terms of what Lenton seems to be saying. However as I have neither a pdf of slides or a paper of what Lenton is saying - I may have read the reports in the press incorrectly.
IMO the tipping point that mattered was the loss of multi-year ice. Nghiem et al show what looks like a tipping point in the precipitous losses of the 2000s. Maslanik doesn't pick this up because his method counts increasing amounts of first year ice in with the multi year. However combining Maslanik and Nghiem supports the idea that we have hit a new steady state of multi year ice.
This is important because because the loss of stabilising multi-year ice can explain much of what is being interpreted as aratic behaviour around a tipping point.
If we do see a massive PIOMAS volume loss this Spring then I may end up joining the 'early camp'. If we don't I'll probably be even more firmly in the 'later' camp.
More: http://www.atmos.washington.edu/~bitz/publications.html
Post a Comment