Before I go further it offers me the chance to offer a public apology to Prof. Ola Johanessen for some rather scathing comments I made prompted by a commenter to that post. The issue was a graph in the post What's Up With D'Aleo, a commenter (Peter) pointed out that the correlation was suspect because the two series, CO2 and Arctic sea ice are non stationary, i.e. they each have a trend. On using such a correlation Peter quite correctly stated: "You could use the exact same logic to find a tree in Kew Gardens that's been growing since 1961 and claim that the height of the tree is causing Arctic ice to melt." However Notz & Marotzke address this, and it's an issue I've been pondering since the D'Aleo post - what if there's a strong reason for physical causation there? I didn't pursue it because my statistics aren't good enough to get into an argument with someone who knows stats well.
Just as I use X/Y plots on scopes on a weekly basis, let's just be clear. Yes it's correct to be careful about correlations between two series with strong trends, but if there is a strong underlying physical reason that could cause the correlation then the situation isn't as daft as the one Peter outlined. From Notz & Marotzke.
However, we do find a significant correlation between decreasing sea-ice extent and the increasing CO2 concentration, with R2 = 0.84 (Figure 4b) [see also Johannessen, 2008]. Given that both time series display a trend, the magnitude of this correlation must of course be interpreted carefully. A direct relationship between CO2 concentration and sea-ice extent can be expected, since the incoming long-wave radiation dominates the annual mean surface heat balance of sea ice in the Arctic [e.g., Maykut and Untersteiner, 1971]. If this radiation is increased because of increasing CO2 concentrations, a decreasing sea-ice extent would be a direct consequence.
The fact that we (a) have strong physical arguments for a possible causal relationship between CO2 and Arctic sea-ice extent, and that we (b) find a pronounced correlation between the two in the observational record is very suggestive of a causal relationship between the observed increase in atmospheric CO2 concentration and the decreasing Arctic sea-ice extent.So let's drop the correlation statistics and just look at the graph.
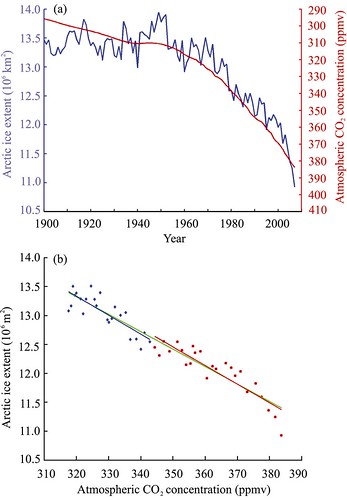
Figure 2 of Johanessen et al, Atmospheric CO2 and Arctic Sea Ice Extent. 1900 to 2007, sea ice series being annual average.
This graph has bugged me since I first read the Johanessen paper, but I've been unwilling to blog again about it because of my confusion of whether it is statistically tenable to use it. Notz & Marotzke offer a more robust examination of the problem, they break the problem down by proposing three explanations for the trend in Arctic sea ice.
1) Natural Variability internal to the Arctic climate system.
2) Self-Acceleration.
3) External forcing.
They find that option 1 doesn't make sense because any one of the minima of 2005, 2006 and 2009 could have been due to natural variability, but 2007, 2008 and 2010 are extremely unlikely to be due to natural variability. They find that independent of the statistical model used it is extremely unlikely that the changes are due to natural internal variability of the sea ice. Option 2 on the other hand doesn't make sense because sea ice recovers in a limited sense to perturbations, so record lows aren't followed by new record lows but by a bounce-back. If the observed trend were due to amplification by the ice albedo effect then these bounce backs would break the process. Finally they look at option 3, external forcing, finding that the trend can be broken down into the same amount of natural variability that happened before the satellite era and a trend of ice reduction. The above Figure 2 of Johanessen illustrates this perfectly, in figure 2a it can be seen that there's low amplitude noise - short term ups and downs that are the signature of internal variability, with a longer term trend imposed on to of the variability. As for other factors possibly causing the long term trend, figure 4 of Notz & Marotzke shows scatter plots of various potential causes for ice loss and sea ice extent.

Figure 4 of Notz & Marotzke.
Changes in irradiance (from the Sun) are in the wrong direction, the clustering suggests a relationship of more sunlight leading more ice, this is obviously incorrect. The Pacific Decadal Oscillation (PDO) and Arctic Oscillation (AO) show little relationship. Other indices are discussed and are not likely candidates. However CO2's correlation is good as can be seen in the scatter plot.
Notz & Marotzke isn't really news to me, given all I've read on the Arctic the linkage to CO2 increases is something I've accepted since around 2008, 2007 being one of the events that finally killed my scepticism about Anthropogenic Global Warming. But it's good to see such a carefully reasoned argument that doesn't directly use model evidence and answers the question - What is causing the changes in the Arctic? In their abstract Notz and Marotzke state:
Our results hence show that the observed evolution of Arctic sea-ice extent is consistent with the claim that virtually certainly the impact of an anthropogenic climate change is observable in Arctic sea ice already today.Of course a virtual certainty won't change the opinions of some. At least research like this means when you come across someone claiming there's nothing untoward happening in the Arctic and that humans aren't to blame, they're virtually certainly just another pub bore - when they're not shouting spite, they're spouting shite.
PS.
Neven asked why the AMO wasn't covered in Notz and Marotzke. It seems to be because they were interested in indices that affect weather, the AMO may not, however they don't explicitly address it. However using available AMO data (specifically the short unsmoothed set) and Chapman's long sea ice series, here, I've done a scatter plot of sea ice extent and AMO index from 1948 to 2007.

The clustering has no shape, so there is no explanatory relationship, certainly compared to the CO2/sea ice relationship in Notz & Marotzke's figure 4 (above) the AMO falls into the same bracket as the PDO and AO. The same applies with the long AMO series from 1870 to 2007.
Johannessen 2008, "Decreasing Arctic Sea Ice Mirrors Increasing CO2 on Decadal Time Scale." https://bora.uib.no/bitstream/1956/2840/1/200806005.pdf
Notz & Marotzke, 2012, "Observations reveal external driver for Arctic sea-ice retreat" http://www.mpimet.mpg.de/fileadmin/staff/notzdirk/2012GL051094.pdf
8 comments:
Nice post, Chris.
Any reason why they didn't check the AMO for a correlation?
Sorry, don't have time to read the paper myself. :-)
Thanks for the post. I'll have to check out the papers, and do some blogging on them myself when I get back home.
In the mean time, I'll make the suggestion that was given to me in a different context. One way of removing influence (well, reducing) of long term trends in a pair of time series is to take the first difference of them. That is, rather than CO2 levels, take the change from year to year.
The downside to this approach is that it ignores, or underrates highly, the portion of correlation that is due to the long term trends being causally connected.
Neven,
See the PS below the main post.
Robert,
This is the problem with the whole CO2 correlations issue, if CO2 didn't have a monotonic increase correlations would be more meaningful and easily persuasive - we've only ourselves to blame for the fact that it's monotonic. ;)
I look forward to reading your comments on this paper.
Cool, Chris. Thanks a lot for that PS.
Despite the intriguing correlation I don't buy the conclusion of this paper. Kwok and Untersteiner have calculated an additional ~1Watt/m² to explain Actic melting.
http://rkwok.jpl.nasa.gov/publications/Kwok.2011.PTO.pdf
So at least the links CO2 -> heat flux -> melting are missing. Also the authors use sea ice extent while volume shows a sharper decline. And by ruling out other possible and known drivers there still might be unknown drivers. In short a way too under-complex approach to explain Arctic sea ice melting.
Arcticio,
The issue of volume is being discussed over at Neven's blog under his thread on this paper. I think this may pose a problem for the issue of ruling out self-acceleration (SA). But think the other threads of reasoning are sound.
I don't see Kwok & Uuntersteiner as being at odds with the claimed correlation. Nor do I see the complexity of the mechanisms - ocean/atmospheric heat, Fram Export changes, etc- as a problem. I do however think that the CO2 link is part of the puzzle: I've been convinced CO2 has a driving role before this paper simply because models forced with anthropogenic forcings show the decline - when not forced in this manner they show no decline in Arctic sea ice. So figuring out exactly how CO2 drives the changes is necessary without this paper.
Going back to Notz & Marotzke in their section on forced response they find that the standard deviations for the satellite period (detrended) and the pre-satellite period are virtually identical. Under the paradigm of SA surely to find this equivalence between two periods, the former with SA (a strong trend) the latter with no SA (no trend) is incongruent with SA - SA should imply a change to statistics like detrended standard deviation. As I understand it, that such a change is not seen supports the interpretation of a forced response that is seperate to the random weather driven variation.
The simple physics says that there should be a correlation. CO2 builds up heat and heat melts ice.
The real problem is the difference in natural variation between the two values. CO2 has little natural variation while sea ice, both extent and volume, has a lot and would have even without any melting trends.
Would a more meaningful correlation not be possible if more smoothing was applied to the sea ice and its variability? If it was smoothed over 60 or even 120 months this would average out much of the natural variability and allow the quantifiable values of the trend be better compared with that of the CO2 trend?
I don't think you need to smooth. The variability you mention is a key part of the message - natural variability around a forced trend.
I've gone quiet because I'm busy with new data. All will become clear next month.
Post a Comment