The issue of what is causing the increased melt season sea ice losses post 2007 is intriguing, there seems to be two candidate players, the ice and the atmosphere. In my opinion 2013's muted melt gives a hint as to what the main player is.
Showing posts with label Arctic 2013. Show all posts
Showing posts with label Arctic 2013. Show all posts
Monday, 20 January 2014

Sunday, 22 December 2013
New PIOMAS Gridded Data: November 2013
New PIOMAS gridded data (effective thickness fields) has been released up to November, hat-tip to Wipneus for letting me know. So I've interrupted my blogging holiday to post on the new data which gives a great view of 2013 from the point of view of PIOMAS.
The regional PIOMAS derived data I have previously released, and which is used throughout this post, has now been updated through to November 2013, it is available in CSV files here. Thickness calculations have not been updated for 2013 because they need concentration which has not been released.
Once again, thanks to Dr Jinlun Zhang and colleagues at the Polar Science Centre for making the gridded PIOMAS data publicly available.
The regional PIOMAS derived data I have previously released, and which is used throughout this post, has now been updated through to November 2013, it is available in CSV files here. Thickness calculations have not been updated for 2013 because they need concentration which has not been released.
Once again, thanks to Dr Jinlun Zhang and colleagues at the Polar Science Centre for making the gridded PIOMAS data publicly available.
Friday, 8 November 2013
The 2013 Sea Ice Rebound (that never was)
There was no sea ice rebound in 2013, what happened was variation due to weather, the process underway in the Arctic has not stopped. But the increased volume of 2013 could still be one of the most useful features of the post 2010 situation. In this post I use PIOMAS data both from the PIOMAS main volume series, and PIOMAS gridded data, also Cryosphere Today Area (CT Area) and NSIDC Extent.
Tuesday, 17 September 2013
2013 Sea Ice Prediction Review
I have previously made two predictions, one early in the season, one late. Both were in terms of CT Area, and as CT Area is now clearly past the minimum the time has come to evaluate my predictions.
Monday, 9 September 2013
PIOMAS Summer 2013
The PIOMAS data for August 2013 has been out for a few days, so I'm a bit later than normal (work + a cold), but it's now time to review the summer and look at prospects for the coming freeze season.
Monday, 2 September 2013
Summer 2013
Rather than do an August status post this close to the minimum, when the take-home message of the 2013 melt season is already clear, I've decided it's best to do a post on the summer melt of 2013. The actual minimum may warrant a further post, if so that will be done.
Monday, 26 August 2013
Prediction Update.
On 6 July I made my final prediction for the CT Area minimum, now at 26 August it's worth seeing how that prediction has done, so far.
Sunday, 18 August 2013
Mid August Status: The fat lady draws breath
Now in mid August the potential for 2013 catching up on 2007 or 2011 is remote in my opinion, so it's worth explaining why I think that as I've been quiet for a while. Damn, just seen that Neven has posted today along similar lines, well as this is written I'll post anyway.
Sunday, 4 August 2013
July Status: PIOMAS Volume
PIOMAS Volume is now available from the main series, I use the term 'main series' to differentiate from the gridded data, the main series data are available from here, bottom of that page. 2013 shows a gain in volume over previous years
Saturday, 3 August 2013
July Status Part 2: Atmosphere
NCEP/NCAR Reanalysis data for July is now available, so it is possible to assess what the atmospheric state has been in July, and for the summer so far. The atmospheric state in 2013 continues to be remarkable in the context of the other post 2007 years, and this is clearly the proximate cause of the slow melt season seen in 2013.
Thursday, 1 August 2013
July Status Part 1: Cryosphere Today Area
The full data for June are now available for Cryosphere Today Area (CT Area). As usual I'm still waiting for NCEP/NCAR reanalysis to produce July average, and as PIOMAS uses NCEP/NCAR data they don't publish their main series on the first of the month. So I'll start by going over CT Area, atmosphere and volume will follow in the next few days.
Sunday, 28 July 2013
If HYCOM is correct.
Looking at CT Area anomalies and the US Navy's HYCOM model, link, I suspect that August may see record losses as did 2012. This means my prediction of early this month is already looking unlikely to be correct.
Friday, 19 July 2013
What does CT Area show?
This post is a few days late due to work commitments, basically a comment on my last post, link, has raised the question; what does the Cryosphere Today Area (CT Area) index actually show?
Monday, 15 July 2013
How Fragmented is the Pack?
There's a discussion going on over at the Sea Ice Forum, link, about whether the pack this year is more fragmented than previous years. I'm with Peter Ellis on this, looking at different satellite systems and at certain areas it's possible to reach either a 'for' or 'against', conclusion. Certain features such as the Laptev/North Pole low concentration anomaly are quite exciting, although it remains to be seen what role that feature will play in the coming season.
I'm not posting to launch into a long boring discussion of the pack floe by floe. I think there's a more objective way to cut to the heart of the issue. The data I use are IJIS Sea Ice Extent index, data, and CT Area, data.
I'm not posting to launch into a long boring discussion of the pack floe by floe. I think there's a more objective way to cut to the heart of the issue. The data I use are IJIS Sea Ice Extent index, data, and CT Area, data.
Thursday, 4 July 2013
June Status Part 3: PIOMAS Volume.
PIOMAS data is now out and shows a similar pattern of a retarded melt season as does the CT Area data. However the volume losses of June still place 2013 firmly in the post 2007 group. All data from PIOMAS, all volume units in 1000km^3.
Wednesday, 3 July 2013
June Status Part 2b - Atmosphere and Ice.
In my previous post I produced a series of sea level pressure (SLP) plots from NCEP/NCAR reanalysis showing how anomalous the SLP field for 2013 is in the context of the other post 2007 years, link. As stated previously, looking at Cryosphere Today Area (CT Area) on 30 June one has to go back to 2009 for a single year above 30 June 2013, and back to 2004 to find successive preceding years of higher area for that date. Given the loss of volume in 2010*, and that this was followed by a new record in the CT Area data for 2011, 2012 then setting a new record by a substantial margin, the late start to the melt season in spring 2013 is highly anomalous. *Whilst this was an event first noticed in PIOMAS it was a real event in the real world, and not just an event within the PIOMAS model, link.
Tuesday, 2 July 2013
June Status Part 2a: Atmosphere - SLP fields.
Rather than present these graphics in an animated gif (which can't be paused), or YouTube (which has poor resolution) I thought it best to put them all on one page. Here is a sequence of NCEP/NCAR sea level pressure (SLP) fields, the 2007 to 2012 average and the previous ten years including this year (2013). Source.
Monday, 1 July 2013
June Status Part 1: CT Area.
OK, rant over, it's time to get back to sea-ice.
Now that Cryosphere Today's area data (CT Area) are in for yesterday, it's possible to summarise the status for June. The take-home message I read from the data is that a new record is now very unlikely based on past year's behaviour due to the late start to melt, despite other indicators of pack condition (for example the Laptev to N Pole region, link). Posts on the atmospheric status (key to understanding the late melt) and PIOMAS will follow when PIOMAS and NCEP/NCAR updates come in for the month of June.
Now that Cryosphere Today's area data (CT Area) are in for yesterday, it's possible to summarise the status for June. The take-home message I read from the data is that a new record is now very unlikely based on past year's behaviour due to the late start to melt, despite other indicators of pack condition (for example the Laptev to N Pole region, link). Posts on the atmospheric status (key to understanding the late melt) and PIOMAS will follow when PIOMAS and NCEP/NCAR updates come in for the month of June.
Saturday, 29 June 2013
The Central Arctic Thinning: Is It Real?
In the US Navy's HYCOM model there is a persistent, worsening and large region of low concentration ice between the Pole and the Laptev Sea, is it real?
Sunday, 9 June 2013
June Cliff Watch
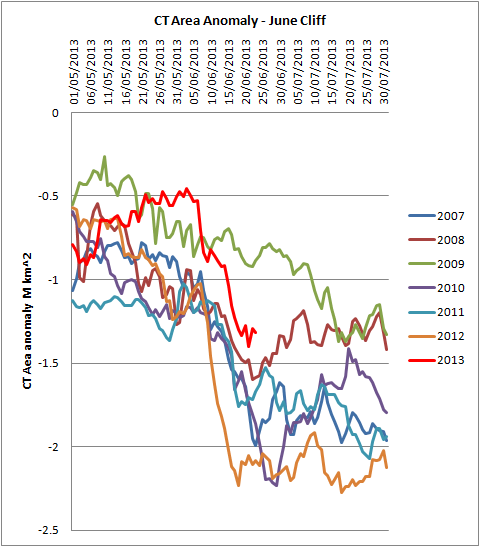
In an earlier post I outlined the June Crash, link, or as I'll now call it in line with others, the June Cliff. It's now happening. Below is a graph of CT Area anomalies (differences from the average seasonal cycle). This will be updated regularly throughout June on this page.
2013 joins 2007, 2010, 2011 and 2012 in having a June Cliff. I'm pretty sure that 2013's June Cliff has now ended, it lasted from 6 June to 18 June. My next post on the Arctic sea ice will be the June Status post, when the PIOMAS data is out, this post will not be updated further.
As mentioned in my previous post, and discussed in the earlier post on the June Cliff (Crash) much of this drop in CT Area is not real loss of area but is due to melt ponding on the ice. This does not mean it has no impact on real area because melt ponds lower the albedo of the surface and absorb more sunlight.
While I now doubt we will see a new record this year, I expect a very exciting season. As with the May Status posts, I expect the June Status to take up more than one post.
Data as of 23/6/13.

In the figures below, Daily is the difference between successive days, Difference is the difference between area on that date and on the same date in 2012.
Date Area Daily Difference
01/6 10.656 -0.035 0.716
02/6 10.581 -0.075 0.703
03/6 10.498 -0.084 0.715
04/6 10.382 -0.116 0.601
05/6 10.291 -0.091 0.535
06/6 10.223 -0.068 0.505
07/6 09.976 -0.247 0.314
08/6 09.815 -0.161 0.301
09/6 09.710 -0.105 0.369
10/6 09.714 +0.004 0.639
11/6 09.617 -0.097 0.775
2013 joins 2007, 2010, 2011 and 2012 in having a June Cliff. I'm pretty sure that 2013's June Cliff has now ended, it lasted from 6 June to 18 June. My next post on the Arctic sea ice will be the June Status post, when the PIOMAS data is out, this post will not be updated further.
As mentioned in my previous post, and discussed in the earlier post on the June Cliff (Crash) much of this drop in CT Area is not real loss of area but is due to melt ponding on the ice. This does not mean it has no impact on real area because melt ponds lower the albedo of the surface and absorb more sunlight.
While I now doubt we will see a new record this year, I expect a very exciting season. As with the May Status posts, I expect the June Status to take up more than one post.
Data as of 23/6/13.
Date Area Daily Difference
01/6 10.656 -0.035 0.716
02/6 10.581 -0.075 0.703
03/6 10.498 -0.084 0.715
04/6 10.382 -0.116 0.601
05/6 10.291 -0.091 0.535
06/6 10.223 -0.068 0.505
07/6 09.976 -0.247 0.314
08/6 09.815 -0.161 0.301
09/6 09.710 -0.105 0.369
10/6 09.714 +0.004 0.639
11/6 09.617 -0.097 0.775
12/6 09.535 -0.081 0.851
13/6 09.452 -0.083 0.898
14/6 09.384 -0.068 0.974
15/6 09.191 -0.193 0.987
16/6 08.992 -0.199 0.962
17/6 08.865 -0.127 0.918
18/6 08.722 -0.143 0.933
19/6 08.595 -0.127 0.749
20/6 08.597 +0.002 0.826
21/6 08.389 -0.208 0.651
22/6 08.403 +0.014 0.816
23/6 08.272 -0.131 0.768
Source data from Cryosphere Today, link.
13/6 09.452 -0.083 0.898
14/6 09.384 -0.068 0.974
15/6 09.191 -0.193 0.987
16/6 08.992 -0.199 0.962
17/6 08.865 -0.127 0.918
18/6 08.722 -0.143 0.933
19/6 08.595 -0.127 0.749
20/6 08.597 +0.002 0.826
21/6 08.389 -0.208 0.651
22/6 08.403 +0.014 0.816
23/6 08.272 -0.131 0.768
Source data from Cryosphere Today, link.
Subscribe to:
Posts (Atom)