So whilst the Americans could be forgiven for thinking that what they're suffering is part of such a paradigm, and therefore that there is a direct role for AGW and Arctic sea ice loss, I don't see such an immediate causal linkage.
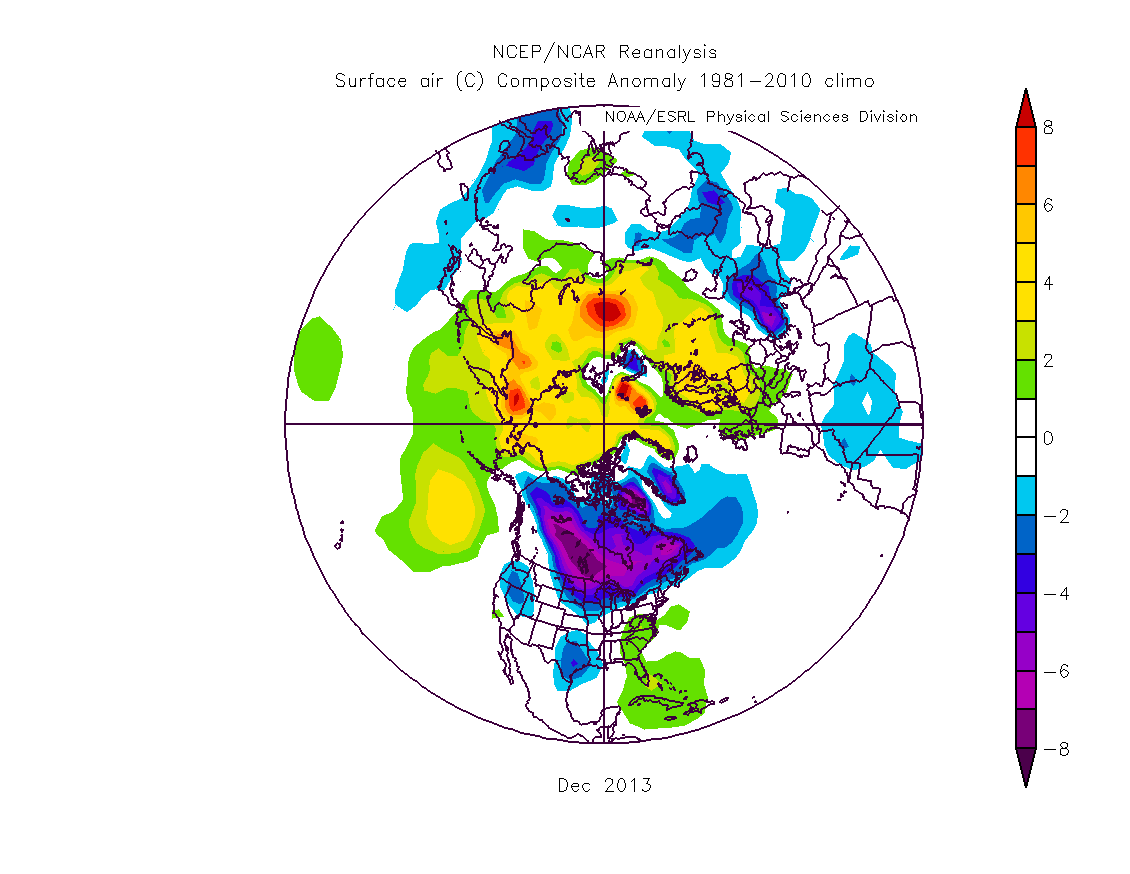
However things are really odd. Throughout December, and continuing into 2014 the UK has been hammered by storm after storm. This has caused coastal flooding, serious damage to coastal infrastructure, and inland flooding from a combination of, heavy rain, high tides and storm surge leading to rivers backing up, e.g. BBC. The cause of this is revealed by the sea level pressure anomaly plot for December 2013.

The intense purple blotch in the North Atlantic is the Icelandic Low, it may seem that only 12mbar below the average isn't much, but bear in mind that this is the average for a whole month. How unusual this is can be seen using an NCEP/NCAR timeseries plot, source.
Taking a grid box over Iceland I've plotted the average sea level pressure for December from 1948 to 2013, this is intended to give an indication of the intensity of the Icelandic Low over the period for which NCEP/NCAR reanalysis data is available.
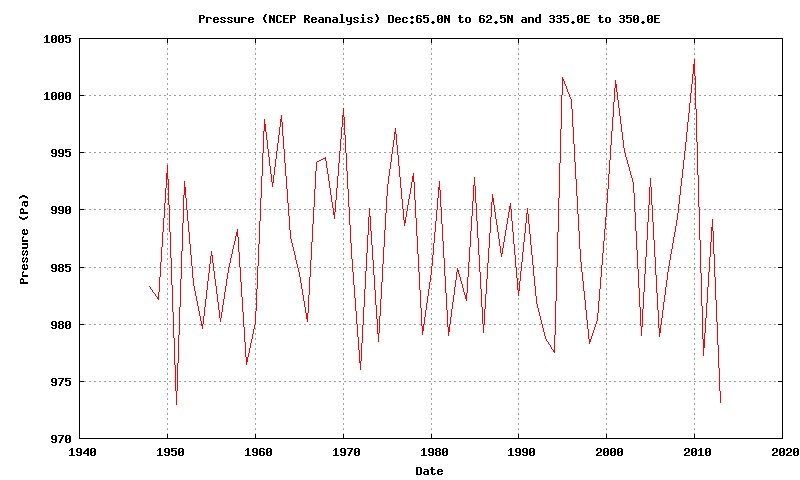
There is only one other year (1951) which has SLP as low as December 2013 in that grid box, and both years are shown to be abnormal outliers lower than other low pressure Decembers by about the same margin. So people in the UK who are saying that they've lived all their lives in such-and-such location and have never seen weather as bad as the last few weeks do have some hard numbers to back up their anecdotal evidence.
BBC Weather has been attributing the run of stormy weather in the UK to a intensification of the jetstream caused by cold weather in North America, the strong temperature gradient between the northern and southern airmasses having created conditions for a very strong jet that has then punched its way across the Atlantic. I had been a bit sceptical of this but now have some sympathy with that view. In such a view it might seem that the jet has overcome any easterly tendency, with associated cold weather in Europe. However the jet has been 'breaking' on the coastal regions of Europe and moving up towards Scandinavia, a flow expected with a high to neutral index Arctic Oscillation index, which has been the case until the last few days. It doesn't seem to me to have been breaking a blocking pattern tendency.
The current cold outbreak in the US has been due to a dipole causing a strong southward flow from Canada, which was anomalously cold throughout December and over the US. Image adapted from from Wetterzentrale.
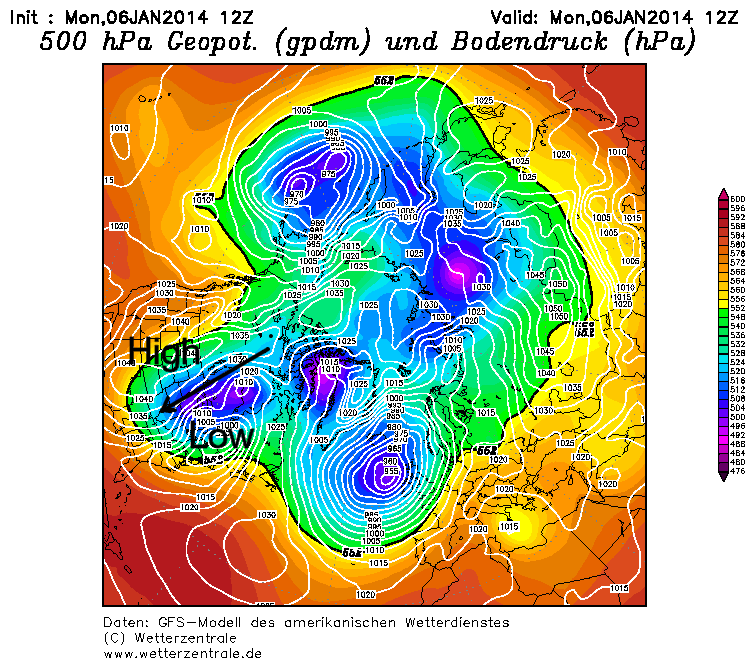
The positions of high and low pressure are marked, flow around high is clockwise, around the low it is anti-clockwise, these combine to act like cogs, drawing a mass of cold air south wards. The result is that temperatures across a large swath of the US are below -20degC, e.g. BBC.
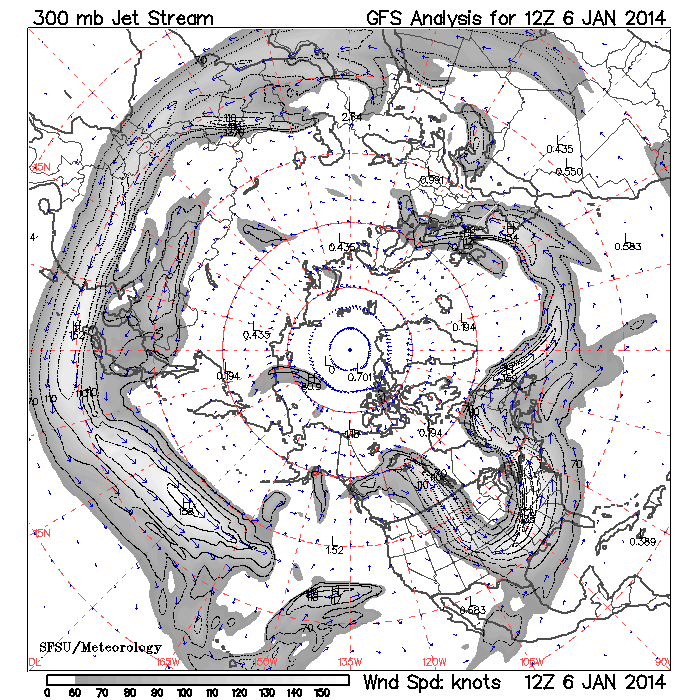
GFS from Wetterzentrale shows the cold outbreak in terms of temperature, although Eurasia is cold, and Siberia colder, these temperatures are more typical of winter conditions there. This cold Arctic Outbreak is seen as a south extending kink in the jetstream in the following jetstream plot from SFSU.
However what really intrigues me is what is going on high in the atmosphere.
The following plot shows long term anomalies in the height of the atmosphere and is from NOAA.
The red anomalies indicate a weak polar vortex, the blue indicate strong polar vortex. Above the 100mb pressure level (stratosphere) the polar vortex has been strong, but below it has been weak, however since late December the vortex aloft has weakened. NCEP/NCAR at 50mb height shows that the polar vortex has initially been located over Canada, but as the vortex strength has declined as measured in the above plot after late December, the vortex has split as shown below.
The latest ESRL Map Room plots for 150mb winds show two vortex centres, one over Baffin Island (Canada), the other over the Taymyr Peninsular (Siberia), link. So whereas the 'cold pole' has been centred over northern Canada earlier in December, at the same time as the vortex split there has been a cold outbreak into the US.
Frankly I don't know enough about meteorology to be sure, but I suspect that the polar stratospheric vortex has developed the cold pool over northern Canada, which has strengthened the jetstream and the Icelandic Low bringing intense storms to the UK, and when it has broken down into a split vortex this cold has broken out to the US to cause a monster polar outbreak. So I find myself suspecting that the vortex is the prime mover in the northern hemisphere weather at the close of 2013 and the start of 2014.
In 2011 Jeff Masters wrote:
Never in my 30 years as a meteorologist have I witnessed a year like 2010--the astonishing number of weather disasters and unprecedented wild swings in Earth's atmospheric circulation were like nothing I've seen.From my following of the years since I consider that they were similarly notable (although I lack Dr Master's 30 years experience), if 2014 carries on as it has started we're in for another staggering year of extremes. As I've watched the flooding and storm damage on the news I must admit that, like many, the phrase 'climate change' has been in the back of my mind, I may be unconvinced of a direct linkage, but more of this is what I'm expecting. Everything that happens in the atmosphere now happens with effects of human caused climate change present and active.
Update: Neven has published a blog post on this subject shortly before I posted this, I wasn't aware at the time of writing. There is a suggestion in the main post and comments that a sudden stratospheric warming may have played a causal role in the collapse of the polar vortex and ensuing US Arctic outbreak.
The sudden stratospheric warming can be seen in the following graphic, saved to preserve the time segment, sourced from this page.
7 comments:
Interesting post, as ususal.
Minor quibble, it's a Northerly wind from Canada to the US.
Adam
Actually on re-reading I see you wrote "flow" (don't know why I read it as wind). Please disregard these comments, and sorry for the noise.
Adam
Jeff Masters showed a jetstream plot back in July in his article Extreme Jet Stream Bringing U.S. Record Heat, Record Cold, and Flash Flooding
The dates have changed, but not the atmospheric conditions over the USA.
Adam,
Thanks. It wasn't well put, I've changed it to "a strong southward flow from Canada..."
Kevin,
Thanks, I don't visit that blog as often as I should. Same pattern different bad weather effects.
I hope this isn't superfluous.
Just thanks.
You might find this site useful, hopefully.
http://www.pa.op.dlr.de/arctic/ecmwf.php
Adam
Geoff,
Never superfluous, it's appreciated.
Adam,
Thanks that really is very useful.
Post a Comment