I'm still not totally convinced this is unusual, but there is reason from the scientific literature to expect more sea ice break ups in the Beaufort Sea.
First it's worth looking at the ice state as seen in polar orbiting infra red satellite images, source Environment Cananda.
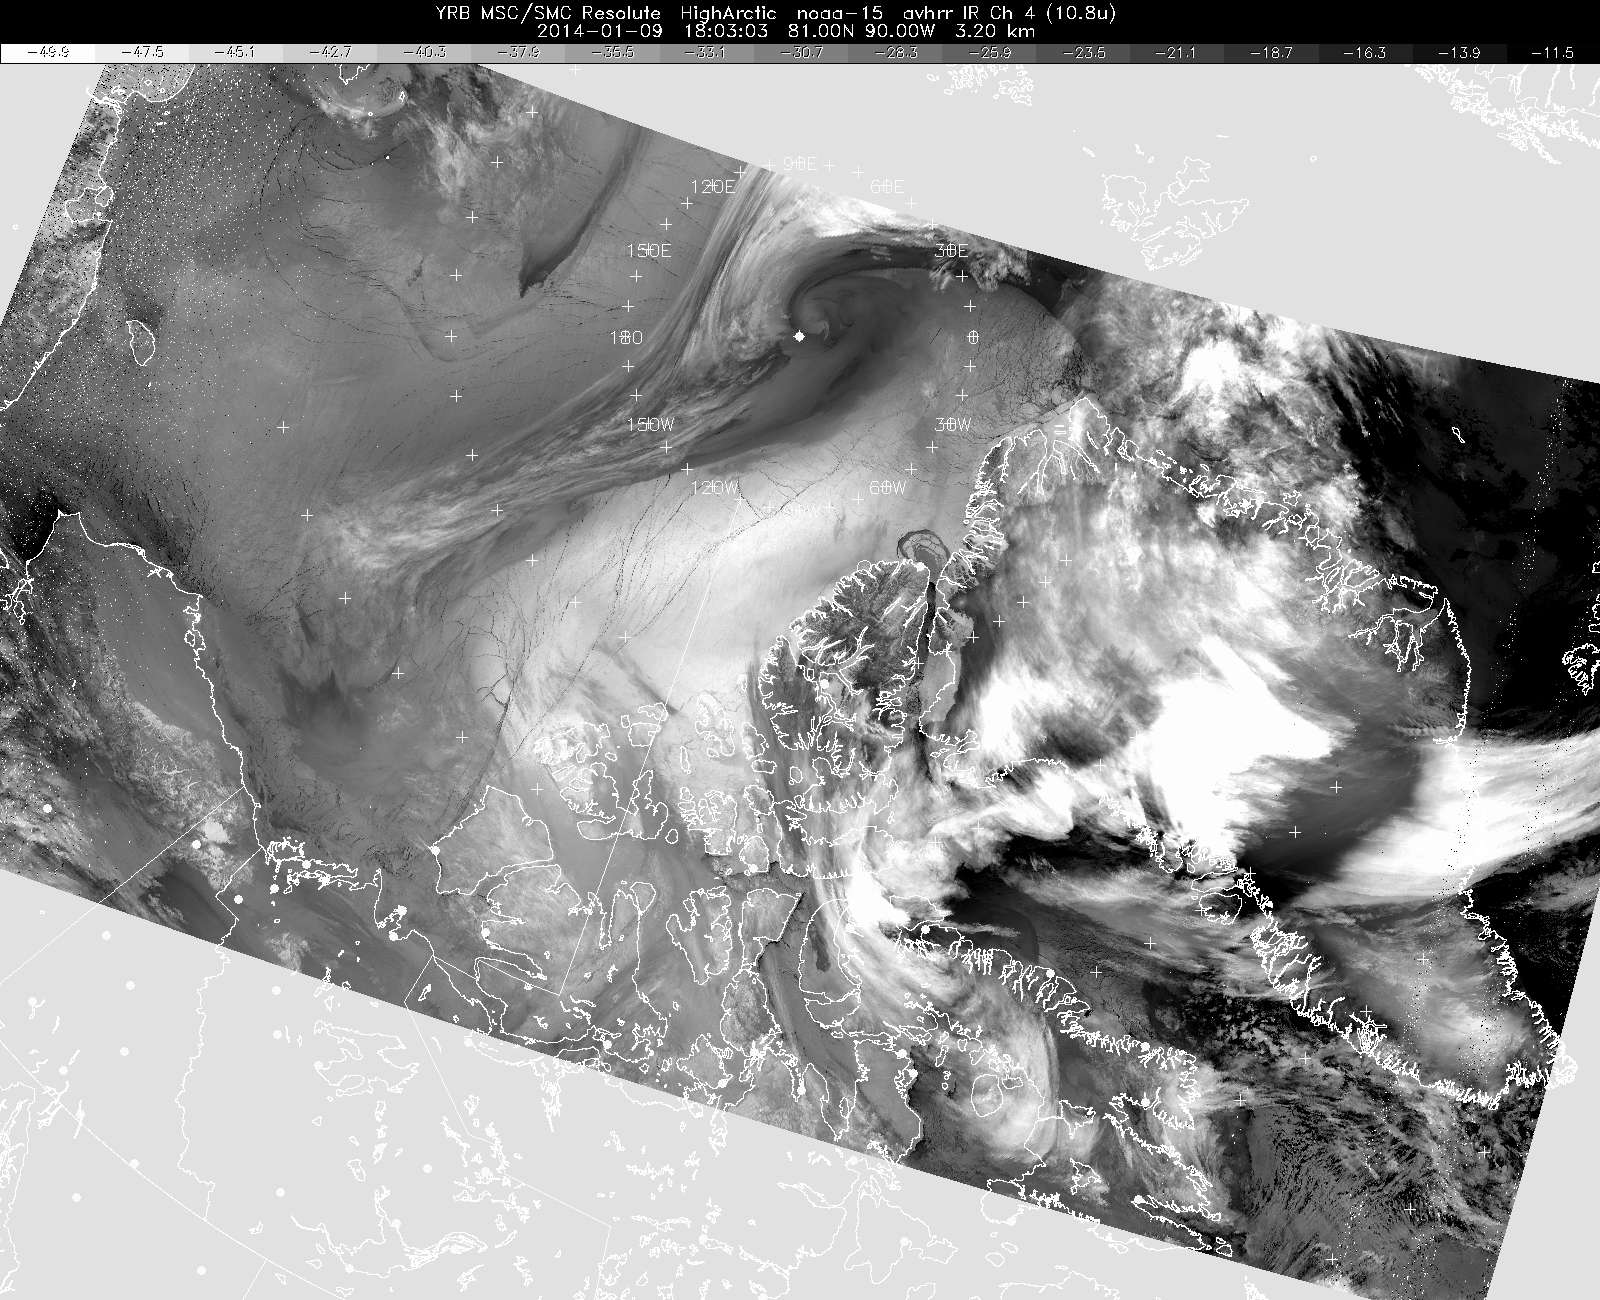
The Beaufort Sea is centre left of the image, fracturing is seen throughout the image, however Beaufort has been left heavily fractured, with fractures running along the coast of the Canadian Arctic Archipelago (towards the rose of compass points overlayed around the pole). As with last year this is because winds have set up a general clockwise motion of the pack placing ice under tension and giving rise to rapid parallel cracking.
Last year there was clear termination of cracks as they reached the thicker multi year ice, which could be identified from ASCAT, see first link of this post for details. That is less evident this year however it provided a clue that ice state in Beaufort (in 2013 virtually all first year ice following the 2012 record minimum) was playing a pivotal role in allowing the development of the fracturing.
Given the difficulty of ascertaining whether one, or even both of these events are unusual (I gave my opinion on that last year), perhaps a more fruitful question is this: Is there any reason to suspect that winter sea ice cracking might be becoming more intense than in the past?
In "Recent changes in the dynamic properties of declining Arctic sea ice: A model study" GRL 2012, Zhang et al use the PIOMAS model to examine dynamic physical properties of Arctic sea ice and how they have changed. The following figure has been amended to put years on the horizontal axis.
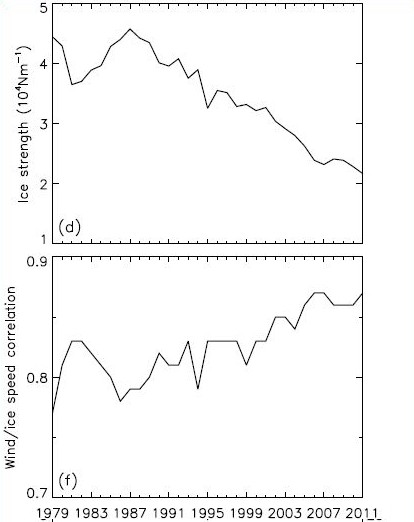
Above is an extract from Zhang et al's figure 1, it shows how modelled ice strength has fallen, in fact this fall is very similar (though not identical to) the decline in volume, which is a result of ice strength being determined by ice thickness and concentration, a finding based ultimately on empirical studies used to develop the forerunners of the PIOMAS model.
As both volume and mechanical strength have declined the correlation between wind and ice speed has risen (bottom panel of the above figure), this is to be expected because the wind has both less mass to carry, and is opposed by less internal ice strength. It is worth noting from the above graphic that since about 2005 the correlation between wind and ice speed has exceeded 0.85.
Zhang et al propose a wind/ice speed correlation of 0.85 as an (albeit arbitrary) benchmark above which ice can be considered in free motion. A correlation is a measure of how well two sets of data match, it ranges from -1 (a negative match e.g. as one goes up the other goes down), through 0 (no match between the two), to 1 (a positive match). So as the correlation between wind and ice speed approach 1 the ice is ever more responsive to the wind. Zhang et al's choice of 0.85 is an arbitrary threshold above which the ice can be considered as behaving like a floe of ice in open ocean would, being blown freely by the wind.
Zhang et al show that in the PIOMAS model the wind/ice speed correlation has increased post 2007, but that this varies throughout the year.
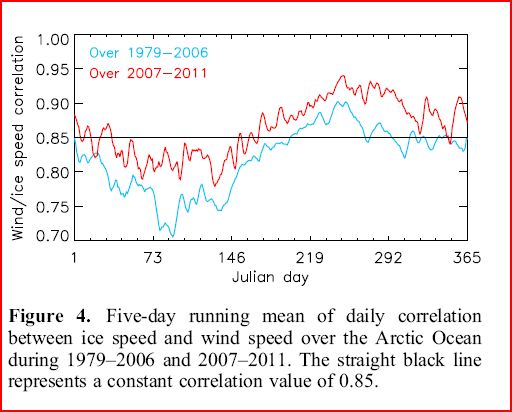
In late winter, when the ice is thickest, correlation drops. As the ice thins into the melt season the correlation rises as the ice loses mass and mechanical strength, as the refreeze starts much of the area of ice is now thin. But following the loss of volume (thickness) after 2007 the wind/ice speed correlation is always above that for the 1979 to 2006 average, and above the 0.85 threshold for far more of the time.
So as the ice in the PIOMAS model has thinned it has responded to the wind more efficiently, and this is for basic reasons, the mass of ice (inertia) and its mechanical strength have both decreased.
In "Arctic sea ice conditions in spring 2009–2013 prior to melt" Richter-Menge & Farrell, GRL 2012, looked at NASA IceBridge flight transect data over two regions, the Beaufort and Chukchi Seas and the central Arctic (off northern Greenland and the Canadian Arctic Archipelago). NASA IceBridge is a programme designed to bridge the gap between the ICESat system and Cryosat 2, also to provide validation data for Cryosat 2. It uses instrumentation in aircraft to monitor sea ice characteristics including, crucially, sea ice thickness.
I'll be comparing the Richter-Menge & Farrell results with PIOMAS in due course, but for now it is their figure 3 that interests me. The following figure has been amended to put the years legend in this pane of the source figure.
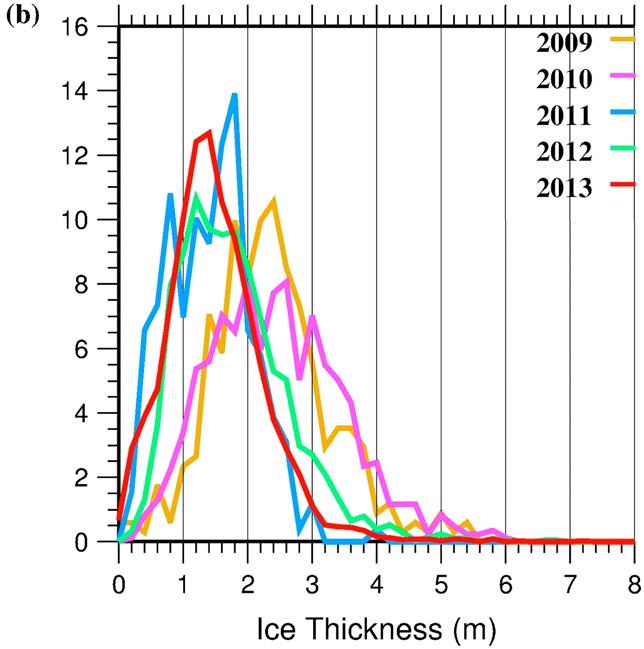
So in Beaufort we have seen a massive shift to thinner ice after 2010, as shown by NASA IceBridge. Data from PIOMAS suggests that at least in the model ice response to wind forcing has increased, due to thinning of the pack. But the physics that give rise to this modelled behaviour concern a reduction of mechanical strength with thinning and loss of mass leading to reduced inertia, both being fundamental issues, so there is little reason to doubt this model finding.
So if indeed we are seeing earlier Beaufort Breakups in response to winds that would not have caused such events in the past, then there is some reason to expect an increase in such events, and I would not find it surprising.
EDIT 19/1/14, Wipneus has been working on 'Home brew AMSRE' data for some time, he has posted a close up animated gif showing the ice movement in Beaufort, see here.
10 comments:
Fantastic analysis!
Thanks Shared Humanity.
While the wind puts the ice in tension and separates the floes after the fracture, I don't think it is the critical factor in the breakup. Both events were caused by very strong high pressure systems and the weakest mode for a large flate plate is a force, or pressure gradient, that is directed along the axis that passes through the thin height of the plate.
It's difficult to pull apart a glass plate along the plane of the plate, but easy to break it perpendicular to the plane.
It's the high pressure gradient in these systems that fractures the ice, not the wind.
There has been a lot of focus on the fracture in February last year but not much recognition of the compressive flows in March/April that ridged those regions of thinner ice into thick masses.
Thanks Anon,
You make a good point regards pressure gradients that I will bear in mind. However I still think that geography combined with movement away from Banks Island plays a critical role in the parallel fracturing.
The ice is very different from a glass plate because glass has significant strength under tension. The ice is in continual movement and is a mass of lines of weakness due to what at a large scale (>100km) seems like viscous movement but at close scale consists of small scale (<1km) fracturing.
Rather than glass, the way I picture the situation is more like a sheen of plaster applied to a stretchy fabric, stretch the fabric and one will get similar opening of parallel fissures. Actually where I've seen a similar effect in industry may have been a more rubbery compound than plaster, I forget the details, but it was the main cause of failure of a piece of kit.
However your point about pressure gradient will also apply to fracturing in other regions of the pack not constrained by geography such as Banks Island and the coast of Alaska. I have noticed this, but it seems to be more common than the parallel fracturing pattern of these two events.
It is worth noting that HYCOM, the US Navy's model, has again shown the generation of a large polynya off Banks Island, rather than a series of parallel fractures, implying that in that system the modelled ice has too much strength under tension.
With regards the April/May ridging, you are correct. Ridging does attract less attention because it is less spectacular. Your cautionary advice is accepted.
Anon - Unless I've completely misunderstood your "directed along the axis that passes through the thin height of the plate", what about tides?
Chris - Regarding models of sea ice, what do you make of Girard et. al. and their "elasto-brittle rheology"?
http://www.elic.ucl.ac.be/repomodx/users/thierry/articles/2011_Girard_et_al_AnnGlaciol.pdf
"Most models of sea ice currently used in climate models stem from the seminal work of Hibler, who described the ice cover in terms of viscous–plastic (VP) mechanics associated with a rate- and scale-independent failure envelope. This modeling framework, based on a fluidlike mechanics approach, where ice flows as a Newtonian fluid for small deformation rates and plastically for high deformation rates, is not suited to describe the multiscale fracturing processes that accommodate sea-ice deformation"
It's quite striking to see the ice going into 'free float' mode nearly a month early since 2007.
And a question: Aren't strong pressure gradients rather a feature of low pressure system?
Chris- The parallel fractures ~followed the isobars of the high pressure system. Surface friction, either by water currents or wind, is to small and too well distributed to induce the tension loads comparable to your stretchy fabric w/ plaster analogy. The fabric is attached to the plaster in a manner that induces local tension on the plaster. I don't think ice on water works that way.
Jim-Tides would clearly cause a similar loading and will influence the location of the edge between fast ice and ice floes, but it does not have a significant gradient over distance. So it's a smaller factor.
Arcticio- Leads in February when it is cold and dark means greater rate of heat loss from the arctic waters, a faster rate of ice volume growth in the leads and greater potential for ridging before spring thaw.
Yes, low pressure systems can have high gradients as well. Highs push down on the ice, lows pull up. It's the gradient that's key, rapid change in pressure over a short distance.
Jim,
I've not got round to reading that paper as yet so can't comment. Sorry.
Arcticio,
Such early break ups are not without precedent in the past. As I say I'm not convinced it's very unusual, but can see reason for such events happening more often.
Anonymous,
The parallel fracture did follow the isobars, but the high in question, e.g. NCEP/NCAR
http://farm8.staticflickr.com/7332/11951734196_7be18e3caf_o.gif
This high had a steeper gradient on it's Siberian edge. However here is an IR satellite plot from 1 Jan 2014.
http://farm4.staticflickr.com/3746/11951719496_ddc048686f_o.jpg
I'm sorry but I don't think the leads in question track the isobars. I still think that what this high did do was induce a largescale clockwise movement of the pack which can be seen in a timeseries of ASCAT. These fractures look more to me like hinging from that largescale movement of the pack.
My analogy was not intended to address surface friction, but to illustrate a non viscous layer atop a fluid. Sorry if that has added confusion.
I do think you likely have a point, and it's one I've not considered. However I do not think it was the main player in the January 2014 or February 2013 Beaufort breakups. Although I suspect this could explain some of the widescale fracturing seen in other parts of the pack.
Being self-taught it is entirely possible I am neglecting the effect you describe, much of the literature I have deals with larger scales in time and space. And because modellers don't normally deal with fracturing it is entirely possible the papers I've read on sea ice motion deal primarily with the effects of wind rather than pressure gradient.
If you can suggest any papers or texts to educate me I'd be grateful. I've not found such which searching in Google and Google Scholar for the last hour.
For your enjoyment:
"...there are two distinct regimes of ice motion and deformation with differing characteristics that contributed to the observed mean: one poleward of 80°N and the other to the south. Poleward of 80°N, we find a net convergence of more than 14% over the period that is a result of the strain rates associated with the response to on-shore wind and motion. This can be contrasted to the nearly 25% divergence of the ice cover, accompanied by a large regional vorticity of −0.93 (or a clockwise rotation of ~53°) south of 80°N. The significant southwest drift north of Banks Island is towards the unconstrained ice-free part of the southern Beaufort and Chukchi Seas. This resulted in a more fragmented ice cover with large fractures (visible in SAR imager) that separate large MYI ice floes."
Kwok, R., Cunningham, G.F., Deformation of the Arctic Ocean ice cover after the 2007 record minimum in summer ice extent, Cold Reg. Sci. Technol. (2011), doi:10.1016/j.coldregions.2011.04.003
Thanks Kevin,
It's also worth checking out one of the references of that paper: "Contribution of melt in the Beaufort Sea to the decline in Arctic multiyear sea ice coverage: 1993–2009" Kwok & Cunningham 2010. PDF.
From my reading that seems to be supporting the idea of the failure of the Beaufort Gyre Flywheel as suggested by WHOI, link. A feature which it seems to me is playing a role in the decline of MYI.
Post a Comment