I'll start with the atmosphere. Arctic ocean surface temperatures in the autumn (Oct/Nov/Dec) have been cooler than the 2007 to 2012 average, which is to be expected given the pivotal role of sea ice loss in autumn arctic amplification.

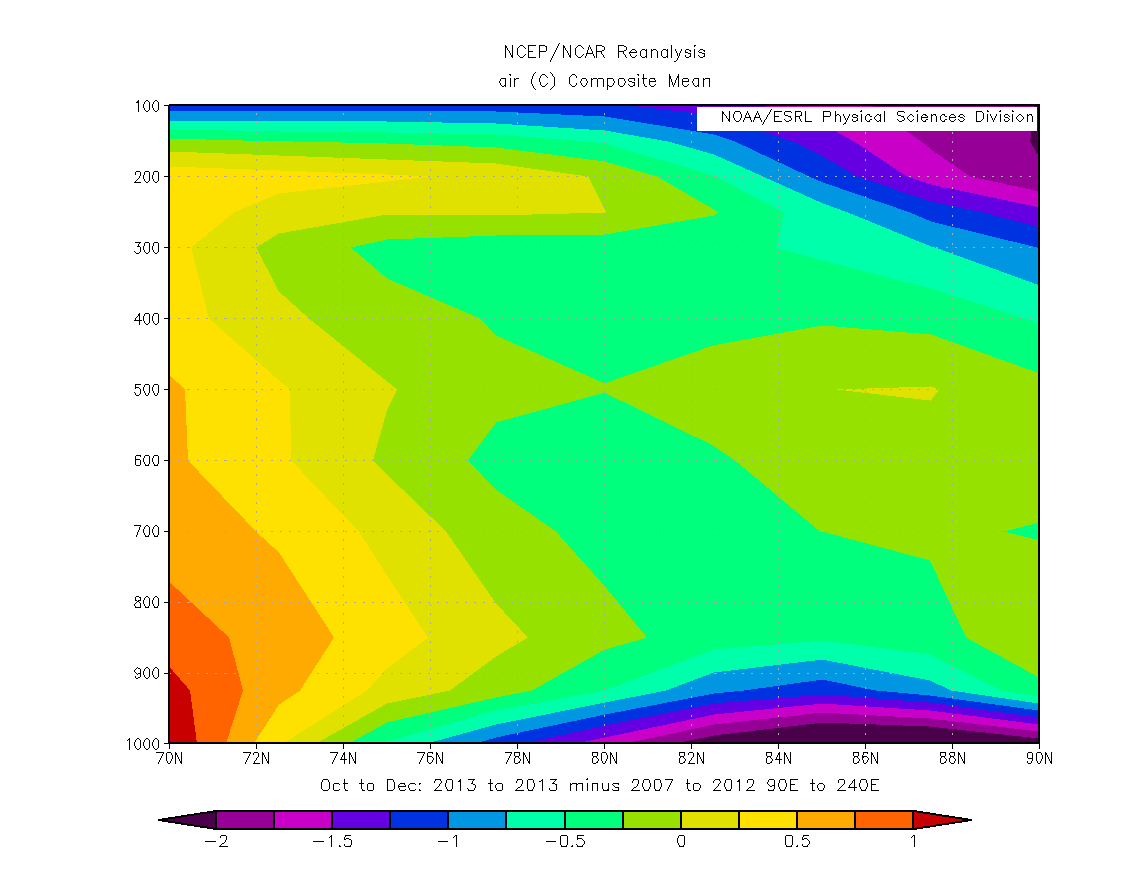
That plot subtracts the average temperatures across the grid from the 2013 temperature across the grid for October to December. It shows that over the Arctic ocean in autumn of 2013 temperatures were up to 2 to 3 degC colder than for the period 2007 to 2012.
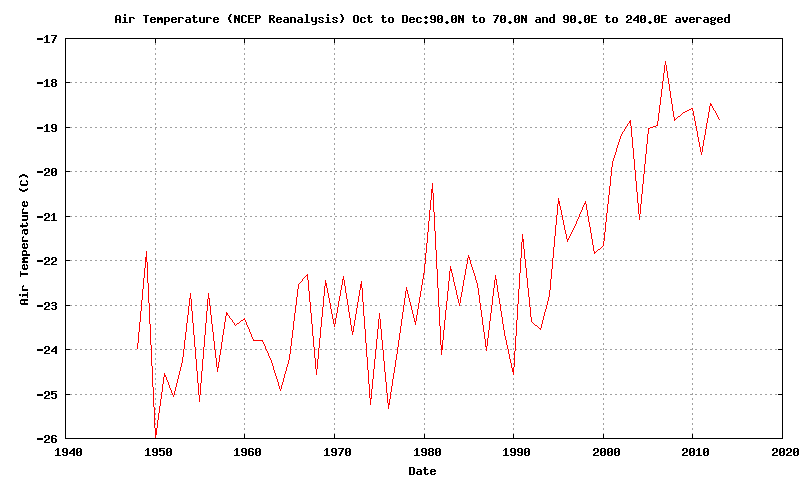
This cooling is seen to be restricted to the surface, so it is reasonable to conclude that it is caused by the increased sea ice cover of this year, not just ice in place during the autumn, but the relative lack of heat absorbed during the summer due to weather and ice conditions. The following plot covers 70degN to the pole across a swath from 90deg to 240deg, a region chosen to reflect temperatures over much of the Arctic Ocean.
One might be forgiven for concluding that autumn 2012 was relatively cold, longer term perspective shows that this is not the case. The following plot covers the same region as the atmospheric cross section above.
NSIDC Extent and CT Area December averages for the available data show that whilst there has been an uptick by the end of Autumn, in the long term context extent and area remain low.
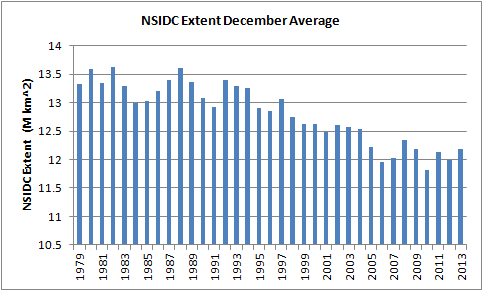
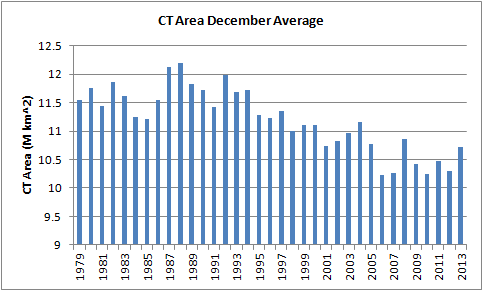
However recently both CT Area and NSIDC Extent have fallen back from higher levels implied in the December average, this may be because much lateral ice growth at this time of year is in the Pacific, where conditions are relatively warm (or so I've read - not checked yet).
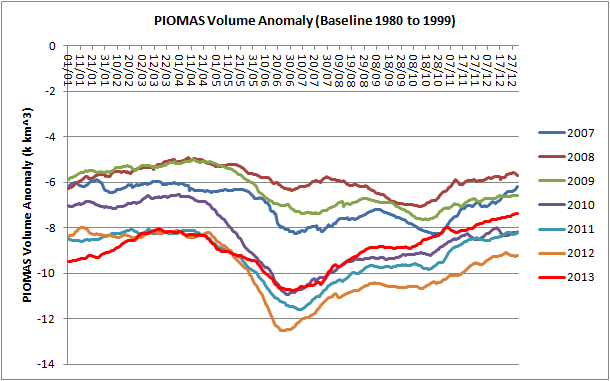
PIOMAS volume anomalies from a 1980 to 1999 baseline show that since the minimum volume has tracked between 2010 and 2011, if this is carried over into the coming melt season it will mean the ice has stepped back three years in terms of volume loss.
By taking each year's freeze season as the year in which the volume maximum happens it is possible to plot the monthly average volumes as series for months September to April.
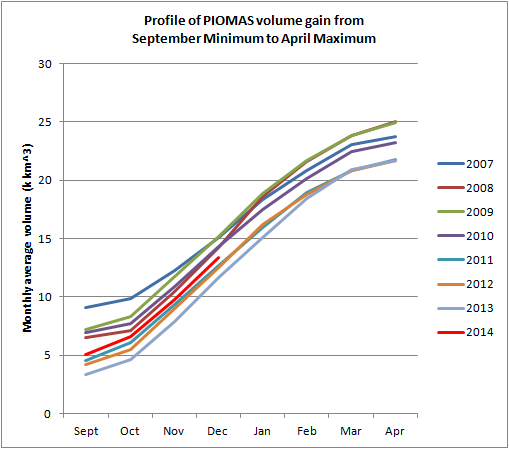
Whilst I still expect the red plot of 2014's volume to continue at a distance above the plot for 2011, the convergence of 2011, 2012 and 2013 to almost identical peak volumes (in April) shows clearly that there is a possibility that the plot for 2014 will converge as those years have, 2012 had a greater volume difference from 2013 in September than did 2014, yet had converged by March.
If peak volume in April 2014 is with the preceding three years I will be drawing conclusions. I understand that such a short period (4 years) is too short statistically for such behaviour, but in a system that's changing as fast as the sea ice I don't think I'll get anywhere if I don't stick my neck out occasionally.
Breaking down the PIOMAS gridded data into regions reveals that the greatest volume gain since 2012 has been in the Central Arctic.
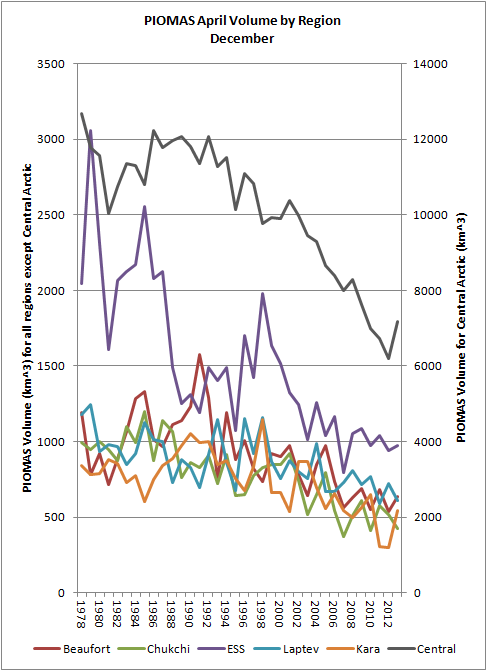
Unlike area or extent, volume integrates impacts throughout the past, for a single year therefore the current volumes tell us how each region has been impacted by the muted melt of 2013. Certainly in terms of the East Siberian Sea (ESS) the impact of the 2013 melt season has been negligible by December, Beaufort through to Chukchi do not show December 2013 as standing out as anomalous. Kara has an uptick following two low years. But it is in the Central Arctic region that volume has jumped, being anomalous in the context of at least the preceding decade.
Comparing 2012 and 2013 by subtracting the December 2012 volume from the December 2013 volume for all regions shows the geographical distribution of differences between those years.
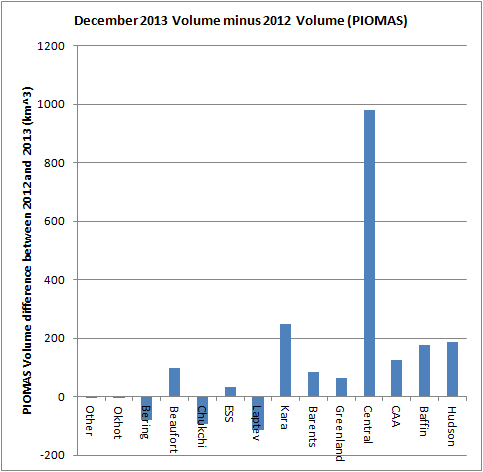
Aside from Beaufort there seems to be a Pacific/Atlantic split, the reasons are not clear, in the sense that they are simple. However in my previous post I showed how north eastern Canada has been subject to severe cold, this might explain Hudson and Baffin Bays, both of which have virtually melted out this year (ruling out substantial volume carry over from last winter), so more intense growth of ice may play a role there. And the Bering and Chukchi Seas towards Alaska have been about 2degC warmer than last year, which may have retarded ice growth, again both of these virtually melted out this year ruling out volume carry over from last winter. However in all the other seas aside from Barents and Laptev there was some carry over, and in all the seas of the Arctic Ocean transport may play a role in December volume.
December is still early in the winter so it's too early to say with confidence what the maximum will bring, but my hunch is still that we'll see 2013's increase of volume carry over into next year. That's why I'm not expecting anything spectacular next year. Normally I'd say we'd have to wait until 20 June to see what the CT Area June cliff brings, but next year we'll have less first year ice, so I'm not expecting that to be spectacular. And whilst I am anticipating an anomalous spring volume drop in PIOMAS, I don't expect it to be enough to wipe out the gains in the Central Arctic, despite much of the increase in spring melt coming from that region (I'll be blogging about that in due course).
Rather than continue what is already a long post, in my next post I'll be looking at December thickness distributions in three key regions: The Beaufort Sea, The East Siberian Sea, and the Central Arctic.
2 comments:
Hi nice post.
You might want to consider a couple of corrections:
90N to 240N is a rather strange area.
I don't quite follow
"2012 had a greater distance from 2012 in September than did 2014"
Crandles,
The 90 to 240 is degrees eastward of the Greenwich Meridion, corrected.
"2012 had a greater distance from 2012 in September than did 2014" has been corrected to: "2012 had a greater volume difference from 2013 in September than did 2014, yet had converged by March."
Thanks.
Post a Comment