We have had some really weird hot weather here (UK), and I've been looking at the Central England Temperature Series (CET). This is an event that is but a small part of a massive heatwave impacting Europe...
Again.
The Normal Distribution is a consequence of the Central Limit Theorem, and from any one of a stack of websites:
The central limit theorem states that if you have a population with mean μ and standard deviation σ and take sufficiently large random samples from the population with replacement , then the distribution of the sample means will be approximately normally distributed.
But what is a normal distribution? It is a probability distribution.
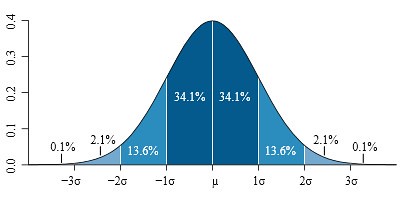
If you invert the above graph you get a valley, or well. That is an instructive way of looking at it, especially when one considers the process by which the normal distribution arises. Basically wherever a set of independent random variables of probability distributions (rectangular, normal, whatever) are combined you get a normal distribution, provided that none of the variables dominate. For example a variable with a range +/-50 combined with independent variables of +/-5 won't produce a normal distribution, the probability distribution will be like the dominant term with its +/-50 range.
Take something like the maximum temperature for a given day, this will be governed by many factors such as the night time temperature, length of day (sun in sky) angle of sun in sky (season) humidity, cloud at. And as a result temperatures fairly well fit a normal distribution whose mean moves up and down with the seasons. But the key aspect is that all of these factors, some driving for higher temperatures, some lower, subject to seasonal constraints produce a potential well within which the daily temperatures move as the seasons progress.
So, something happened on 18th and 19th of July 2022 in England, and it really was remarkable. Basically for the 1951 to 1980 baseline in the CET it was a 8.6 sigma event, that is an off-the-scale event far exceeding all prior excursions since 1900. I've never experienced the like of it in the UK, the CET data supports that personal impression, I live within 50 miles of one of the CET sites. This event has brought out the right-wing NPCs, nothing exposes right-wing ideological capture more than the subject of climate change, it's their version of the gender ideology clown-world occupied by the left.
I will have more to say about the CET data in a few days, day-job allowing.
So we have the sense of a potential well, as discussed before in a different context. Various factors interplay to create a normal distribution centred on the average temperature for that time of the year. Temperature wobbles around within the potential well centred on average temperature. Sometimes factors kick things far outside the normal range of variations, and an 8.6 sigma event contains information, it is not enough to shrug this off as random variance. It is reasonable to say that the large scale synoptics, drawing in air from the south played a role. It is reasonable to say that the dry months preceding had a role in drying the ground, so that energy that would have gone into evaporation went into temperature increases.
However we've had since 1900 in the subset of the CET that I have considered, for this parameter space to be explored by natural forces, and never has it come up with 37.3

Frankly, at this late stage, any right-wing NPC struggling against the acceptance of climate change is merely an empty character in a farce, symbolic of their struggle against reality.
Don't argue with them, it makes it look like they have an argument.
Mock them.
Mock them without quarter or mercy.
No comments:
Post a Comment