RealClimate notes that the record is consistent across all the major instrumental datasets, however as usual I will concentrate on NASA GISS, which in my opinion is the best index for reasons of transparency and data coverage.
So here is the NASA GISS Land Ocean Temperature Index (LOTI), shown together with the trend and residuals from the trend from 1975 onwards, the period of the most recent episode of warming.

It is worth noting that the residual for 2015 is not highly unusual for the period 1975 to 2015. It is also worth noting that the large residual in 1998 was due to an El Nino event that ran from summer 1997 to summer 1998, this may have implications for next year's temperature.
The role of the El Nino is interesting. I suspect the denialists may be claiming the El Nino has driven this record (indeed some are - see appendix). I further suspect that they may scrape the bottom of the barrel and come up with the execrable McLean 2009 farce in which the authors demonstrate their lack of grasp of basic calculus and come to the incorrect conclusion that the ENSO drives global warming. (Hint the derivative of ax + b is a, taking the derivative removes the trend so the resulting analysis can say nothing about the trend)
So let's look at the role of the ENSO.
Here I turn to NCEP/NCAR. But first here is a plot from GISS Maps of their temperature anomalies.

Which can be compared with NCEP/NCAR anomalies for the same baseline average anomaly period.
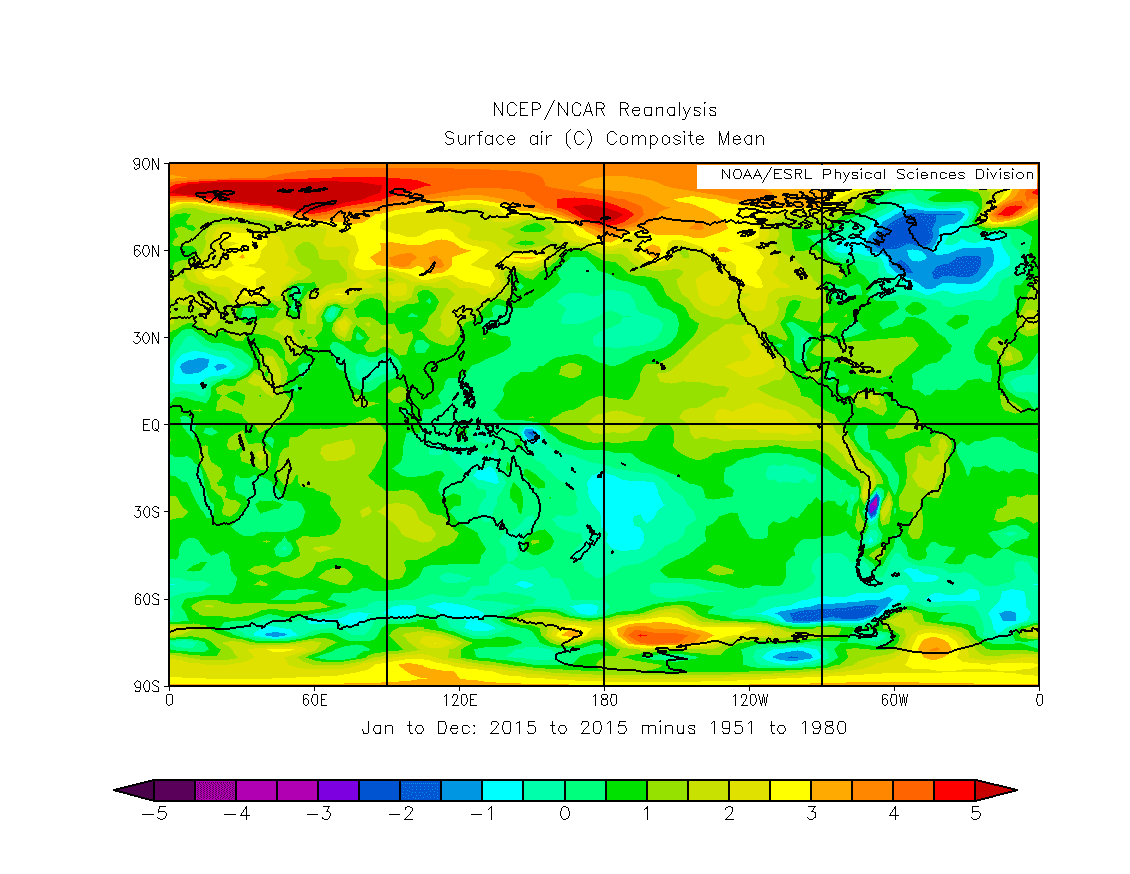
The point here is merely to show the similarity between the modelled and instrumental temperature fields. The North Atlantic cool spot is evident, the warm regions across Eurasia and North America agree, as does the warm pool in the equatorial Pacific due to El Nino.
Now for a regression of the January to December MEI ENSO and surface temperature from 1950 to 2015. The North American dipole of warm west, cool east seen in the 2015 data may indeed be due to the El Nino, which started in the spring. However contrary to the regression there is a northern Eurasian warming where the regression shows a patchy cooling with higher MEI ENSO index. Note that the cooling in the western North Atlantic may be due to the ongoing decline of the Gulf Stream Circulation as discussed at RealClimate.

The pattern of warming from the regression of Global GISS temperature and surface temperature for 1950 to 2015 is shown below. This is a more general pattern of warming across the Arctic and continental north.

Now to look at the GISS LOTI data as hemispheric averages. Here it is clear that whatever process made 2015 such a large new record it was dominated by the Northern Hemisphere (And some!). At 1.13degC anomaly, in 2015 the Northern Hemisphere was above 1degC anomaly for the first time in the instrumental record.

As the above two regressions show the ENSO produces a mixed impact with warm and cold, but the regression with GISS temperatures shows a wider northern hemisphere warming. The observed pattern of warming suggests to me that both AGW and ENSO play a role in the 2015 record. However to try to blame it all on ENSO and ignore the overall increase of global temperature that underlies such an effect is either stupid or mendacious.
It is possible to look at the effect of the El Nino on the 2015 record in a numerical sense, Gavin Shmidt at RealClimate does something similar with 2 month lagged monthly values. Taking the period 1975 to 2015 the relationship between ENSO and global average temperature anomaly is worked out as a linear fit to a scatter plot. Then this relationship is used to calculate temperature contributions to the overall global warming trend (Model + Trend). The results are plotted below. 1975 is used as the year when the recent linear increase in temperature started as calculated by Tamino.

For 2015 this method indicates that of the 0.11degC above the trend 0.06degC was due to the El Nino. With this contribution of the El Nino removed the 2015 temperature anomaly would still have been 0,81degC, a new record by a substantial margin, though not as substantial as the actual anomaly 0.87degC.
Maybe not next year, but as each year passes it becomes increasingly inevitable that the 2015 record will be beaten. If the current rate of warming of 0.17degC/decade continues then by around 2030 we will hit 1 degC warming. There comes a stage, and that is where I am, when one more record high of temperature or record low of sea ice holds less and less interest for me. The process of human driven global warming is ongoing and new records is just something it will bring.
Appendix The AGW Denialists respond squirm.
The walking epitome of Poe's Law that is Steven Goddard opines that the NOAA surface temperature record is a fraud, and concludes that satellite temperature data is the only reliable data, which is just wrong.
Watts Up With That engage in a whining and obfuscation spree, here, here, here, here, here (Have these dishonourable bastards have moved from bullying Michael Mann to bullying Gavin Schmidt?), and here (where David Whitehouse adds to the already ample evidence that he is as stupid as a bag of hammers). I have called them WTFWT in the past, I now think it is more appropriate to call them What is the Point?
Pierre Gosselin's No Tricks Zone engages in the sort of behaviour one would expect from a site so named in harking back to early projections of climate change. The subtext I read here is that Gosselin disrespects people for changing opinions as understanding advances, what am I to say?
The GWPF respond by repeating Whitehouse's hogwash, continuing their trajectory into irrelevance.
I could continue but it's all much the same over in Narnia. For me the bottom line is that this reeks of the sort of cack-handed evasion and obfuscation of any group of fundamentalists when placed in a position where the evidence is running against them. And as an atheist who has taken on the Abrahamic faiths for many years I am all too used to such behaviour.
8 comments:
Per Andrew Slater's website, this looks like the largest (warmest) FDD deviation at 2m N80 in the dataset - or at least in recent years.
http://cires1.colorado.edu/~aslater/ARCTIC_TAIR/index_80_t2m.html
Should make for an interesting spring (and summer and fall).
Hey Chris,
I was wondering what your thoughts were on February 1st ice extent being the lowest on record for the date at the moment. Is it a sign of a possible trend or just not really a big deal at the moment?
Kevin,
Thanks for that. After JDAllen's question about the calculaion of FDDs I did calculate Reanalysis 2 FDDs for ocean north of 70degN up to the end of data (data runs to July 2015). I'll post when I get the chance.
Dreesen,
Sorry I've not had the chance to look at sea ice for over a week. It will be interesting to see if the pattern is the same as last January.
http://dosbat.blogspot.co.uk/2015/02/january-status-extent.html
Thanks Chris,
I know you follow Tamino's blog. My take is that he's pretty good, but he can be over the top sometimes.
Dreesen,
Well as someone who has little time for 'political correctness' and a liking for comedians like Frankie Boyle, his PC attitudes do grate on me somewhat. But I've only once read him being in argument on data and analysis when I thought he was wrong (forget what that was). The other times I've thought he was wrong, further thought has shown I just didn't get it at first. Were he a consultant I was hiring, as I have cause to do, he's the sort of chap I'd hire again.
Anything in particular cause your comment?
PS - I will download sea ice data and have a look with intention of posting.
It's not so much his analysis. That's spot on. It's sometimes the rhetoric, saying the U.S. (my country) is an emissions laggard when Obama is cracking down on fossil fuel emissions through the EPA and that U.S. emissions have declined over the past decade. That rubbed me the wrong way.
I can understand that. For me in all areas of life 'politics is the art of the possible'. I have little time for people who whine because the world isn't exactly as they want it. The world is as it is, nobody is going to persuade the majority to give up fossil fuels, so we must make do with what we have and accept with good grace small movements in the right direction.
FWIW as a Britain, I think Obama has made the best of a difficult situation and I respect him for that.
If the American public vote in that nutjob Trump, maybe then the whiners will wake up to themselves and realise how good they had it with Obama. I'm hoping that the GOP won't be so stupid as to let him through the caucuses.
I completely agree with you on that point. I can't tell you how many people I've come across who always bitch about the capitalist system. I don't even bother anymore. As far as the election here goes, I think the Democrats will probably win. The GOP only has a chance if Rubio wins the nomination, and that's looking iffy.
Post a Comment