Click the image to enlarge.

Image from Environment Canada HRPT visible.
Having posted this, I have been driven to carry on with some more data...
Above this region temperatures are rising as warm air is drawn in.

And Neil asks over at Neven's Blog about the drop in concentration shown in Bremen plost for the Chukchi Sea.

Normally I'd say wait few days, but this could actually be real and not due to weather fooling the sensors, for a start the sky is clear, and in favour of actual ice loss the air is warm, and winds are northwards over this region.
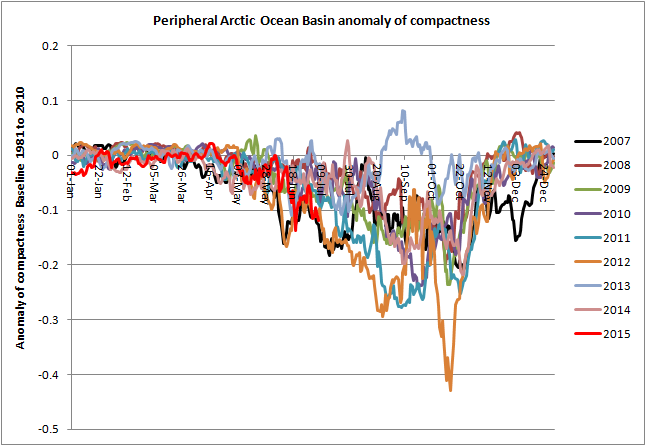
The Peripheral Seas or the Arctic Ocean Basin are the Beaufort Sea, Chukchi Sea, the East Siberian Sea, and the Laptev Sea. They are shown in the graphic below highlighted in red.


I have given myself until Friday to decide whether I will enter a revised prediction for July's SIPN.
11 comments:
Chris, given the areas of rather significant heat in the Arctic right now, where do you see the September minimum possibly ending up?
It's Friday :)
Dreesen, Nightvid,
Beaufort is hard to call, compactness, extent and area are falling at an average rate. I suspect we'll see a persistent low concentration state that will hold up extent. This is because of MYI in the region. The early decline of Beaufort slowed when the ice edge hit the thicker ice in HYCOM, it is proving to be quite an impediment, and I suspect a state similar to ESS in 2010 will develop.
Chukchi is suffering a rout. More about that in an upcoming post.
ESS is falling at faster rates than usual for early July.
Laptev is behaving fairly normally for early July.
Kara is well ahead of the pack and over halfway towards melt out.
CAA compactness is low, extent is falling.
Central compactness is at the low end for early July. Extent won't do much until early August, area is falling but it is too early to say how it will pan out.
I had an email from Brit at ARCUS asking what I wanted to do with regards a forecast for this September. I said they could post the same prediction as my June submission based on April PIOMAS data, but they will add the following statement I sent to them.
"I hadn't intended to submit for July and August, my expectation is now lower than my June submission (bottom half of my range, possibly lower), this is largely based on ice state (PIOMAS/US Navy model thickness, and extent, area, compactness anomalies) in the peripheral seas of the Arctic Ocean Basin (Beaufort round to Laptev). However the prediction based on April volume is intended as a test of April thickness/volume role in September extent. As such it can stand for both July and August without amendment."
So, I'll take that as an indication that it won't come very close to 2012 minimum extent. Just one last question before I leave you alone for a while, Chris. What's your take on A4Real's latest post? http://megiddo666.apocalypse4real-globalmethanetracking.com/2015/07/global-mean-atmospheric-methane-breaks.html
I tend to this it's just part of an upward trend in methane concentrations. Nothing too too worrying I think.
Dreessen,
Interesting, I didn't know s/he had a blog.
To quote:
"What is very troubling is that the July 8, 2015 reading is 23 ppbv above July 8, 2014 and 30 ppbv above July 8, 2013"
At around 1800ppb, those are increases of the order of 1 to 2%, but I don't know if they are outside of the estimated uncertainty - can't find information on that.
I also cannot see a link in that post to numerical methane data. I have asked what the source is.
Hey Chris,
It's also worth noting that it's just a spike for that particular time period, and considering that the mean rate around November was close to 1825 ppb, it may not be abnormal. I tend to think the increase over the past two years is due to the wildfires (including in tundra) and increased fracking. Am I totally off the mark in thinking that?
Dreesen,
Both inadvertent human emissions (e.g. fracking) and fires will play a role. But I agree that what counts is the trend, not blips.
Of course even fracking released methane adds to the problem of AGW, even if it is a small impact, it's an impact in the wrong direction.
True, but the trend a4real points to is probably not consistent with rapid hydrate release?
Well the SLR rise at present isn't consistent with a massive increase in SLR over this century, but that doesn't mean it rules out further massive increases.
A4R has replied, the numeric data is simply what s/he has recorded from the mean stated on the images.
The CH4 trend s/he is highlighting is a tough one to figure out. If you couple that with the levels measured at the NOAA stations, it's clear there's an acceleration in 2014-15, but not consistent with rapid hydrate release. If that were happening, it would literally be off the charts.
By SLR, I assume you mean the CH4, right?
Post a Comment