It's struck me that I use the term anomalies, but don't often explain what they are, so explanation may be needed for some readers. Anomalies are calculated by calculating the average for each day of the year, then subtracting that daily average from the actual value for a given day in a given year. This gives the daily difference from the average, and removes the seasonal cycle, highlighting differences from the average seasonal cycle, in this case the average seasonal cycle for 1980 to 1999. Others use different baselines, that's of minor importance, a different baseline merely shifts the anomalies up or down, it doesn't change the shape of the anomaly plot for a given year, nor does it introduce the sort of change of behaviour seen in anomalies for recent years.
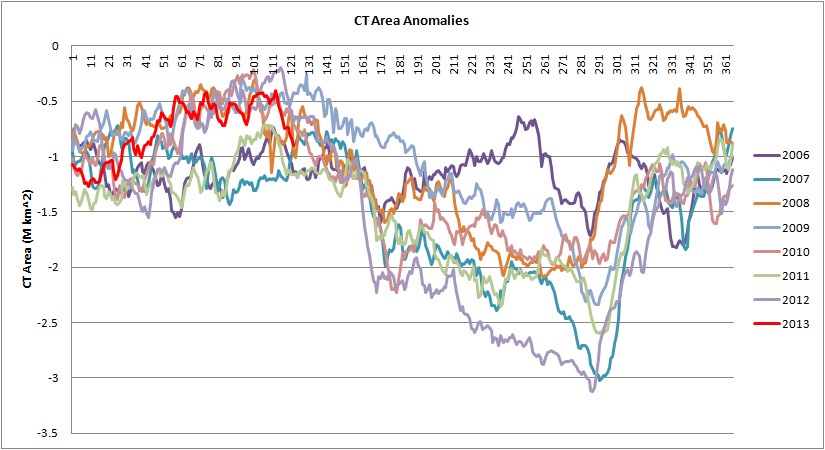
Cryosphere Today area (CT Area) anomalies are shown above, as with 2012 this year's anomalies have entered into a large drop after about 20 April (after day 111). Whether this means anything or not I do not know. For me CT Area will really get interesting in the first week of June when as with 2007, 2010, 2011 and 2012 I expect a rapid drop in anomalies due to aggressive early start of melt within the Arctic Basin, compared with the long term average. I'm very confident that this will happen to the same degree as 2012, likely greater, due to prevalence of thinner first year ice (FYI) this year. At present conditions in the Arctic Ocean itself are not very relevant as area loss has not commenced there. However the situation for volume is different, because volume gets contributions from within the Arctic Ocean, not just the ice edge.
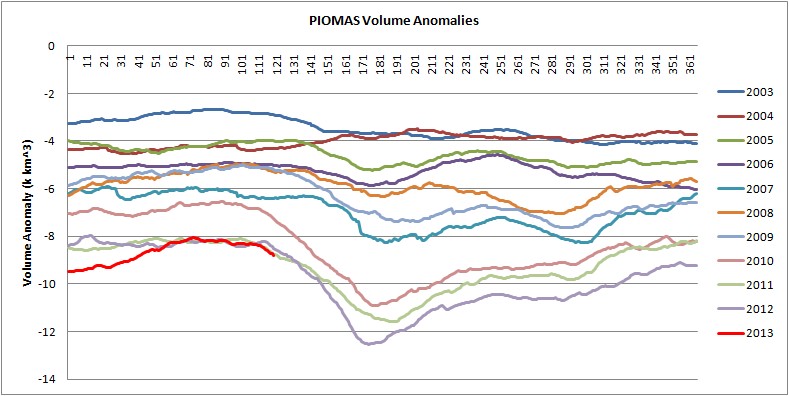
Above are the PIOMAS volume anomalies, using the same baseline. The latest PIOMAS data is up to 30/4/12 and is clearly suggestive of the start of the Spring Melt Anomaly. Why might this be happening at this time of year?
Average temperatures north of 70degN are about -14.6degC in April, warming by a massive 9.6degC to -5.1degC for the May average (2000 - 2012, NCEP/NCAR link - direct to table generated by their system, slow link). GFS supports this, link, with current temperatures being around -10degC off the Canadian Arctic Archipelago to 0 degC around the continental coasts. So over much of the pack the temperature difference between ocean and air has reduced compared to April so as to massively reduce heat flux through the ice, and consequently reduce growth of ice by accretion on the base of the ice (ice/ocean interface). The exact details of what is going on during the Spring Melt Anomaly are still not clear to me, but it seems the substantial warming between April and May is the reason this anomaly starts in late April. As we seem to be at the start of the same process this year I will be posting again on this in the coming weeks.
This year's daily volume peak is now available of course, at 21.823k km^3 (on 16/4/13) it is slightly below the last two years (21.961 and 21.923 respectively). This is not substantially different but still means that technically every daily winter volume maximum since 2008 has shown a drop on the preceding year. Since 2000 only 2001, 2005 and 2008 have shown increases in winter maximum volume on the preceding year.
The issue of whether we face a tail or a fast crash still interests me, specifically whether autumn ice growth could act as an opposing force to summer melt, leading to summer losses to decrease. If the occurrence of a summer ice free state is not to occur before 2020 then this seems to me to be the factor most likely to cause such a delay. Two other factors will be angle of incidence of sunlight as the melt edge nears the pole, and the ice edge behaviour over deep water in the central Arctic Ocean. However I had been expecting these two factors to contribute to give a levelling near minimum, this did not happen when 2012 smashed the 2007 record, link, so I am not convinced of the power of these factors.
As the plot below suggests, a seasonally free ice Arctic Ocean does seem likely within a few years based on naïve extrapolation.

In this graph simple polynomials are fitted to the daily maximum volume for each year, and the difference between daily maximum volume and daily minimum of the following summer. There is no physical underpinning, it's simply a case of answering the question: What if current behaviour of increasing summer period melt and winter period volume maximum were to continue? In 2016 the two trend lines meet, implying that if these trends continue then in that year the volume loss during the melt season will equal the maximum winter volume implying zero volume of ice at the end of the melt season. In reality you could say +/- a few years. But based on current conditions I'd suggest that 2016 - 3 = 2013 is not realistic. It's worth noting that there is no physical need for such an estimate to have equal uncertainty bounds either side of the stated year.
The recent three years have shown near equal peak volume, albeit with a slight downward tendency. Does this mean that autumn/winter volume growth increases in response to record or near-record area at minimum (thickness/growth feedback) are beginning to counter the volume loss? It's too early to say, all that's happened so far is that it's put the winter maximum volume back on the trend line.
The data are available in an Excel spreadsheet here, don't wait for Google Docs to display as it cannot do so, the file is a multi-page spreadsheet in Excel format. To use the sheet select File>Download, and open or save to hard drive. PIOMAS daily series is available at the bottom of this page. Cryosphere Today Area is available from here.
2 comments:
Chris, thanks again for updating the sheets. Saturdayeveningthoughts:
- is it possible that winter maximum is set ultimatly by heat radiating to space, and hence water freezing. The slow downward trend being created by oceanwater slowly heating.
- summer minimum is influenced by many more factors, insolation, meltpools, polar superstorms, ocean currents, soot in the snow, broken chunks melting faster than big oieces etc.
This would mean that winter max and summer min are ever diverging, and this would need to lead to rappid spring melt accelleration.
Time to dig into the sheet myself i think :-)
Lars,
Hope the sheets are of use, It's just a slimmed down version of the one I use, so I thought I may as well make it public. There's a guide to writing such a spreadsheet here, which may prove useful for those wanting to adapt it themselves.
Yes, during the autumn/winter the primary driver is heat flux through the ice which is ultimately radiated to space. I've found that it's relatively easy to account for most of the change in volume gain over autumn/winter using a simple equation. Technically I can account for 50% of the variance, but this figure is lowered due to the long period of little change in autumn/winter volume gain. The overall fit is better than an R2 of 0.57 would suggest. I'll be blogging on this in due course.
However the change in spring/summer volume loss is proving to be much harder to quantify, and is indeed due to a more complex process. The factors you suggest are a good summary of the sort of factors that may be involved. However because I see the transition from MYI to FYI and open water formation efficiency as driving the change in area/extent, with volume being the key underlying factor. I see starting (April) thickness, and MYI distribution as key to most of the change of volume loss during the melt season. I'll be blogging on that when my ideas are a bit more solid.
Post a Comment