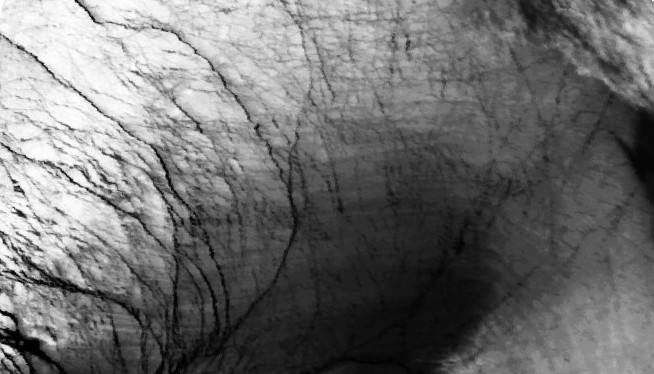
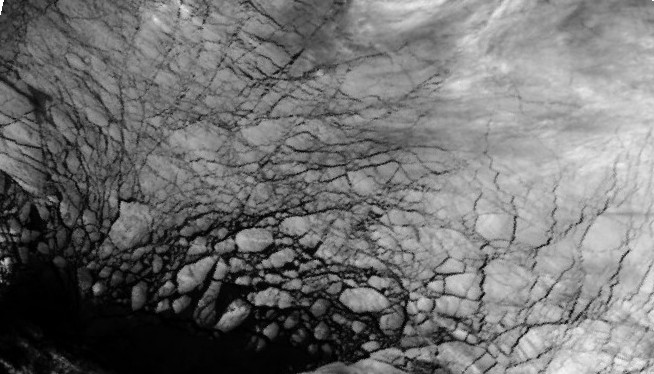
Here are four images of exactly the same location in the Arctic ice pack in four different years. They're from satellite infra-red, 3 are for roughly the same period, one is earlier due to a gap in image availability. The images have been selected for clear skies, ice state is typical, as shown by the persistent pattern of ice cracking. The location has been chosen as it should reveal changes in ice state being a mechanically 'interesting' location. The images have been rotated and/or mirrored, and land cropped out to hide the location, there has been no further manipulation of the images.
Which image is from 2013?


23 comments:
Chris, you crack me up! :-)
I'm going for number 2. I clearly recognize the other three from previous years.
I'm going with image number one, which I would say is mirrored left/right of MorrisJessup.
B
Neven, DaddybFree,
Thanks for the suggestions.
No comment from me until the weekend.
I'm not an expert, but I did win a lot of money at Intrade betting on a new record low extent last year...
I'm guessing 4, as it seems to have the least ice.
WAG #4 - rotated 90 degrees east of Morris Jesup, north of Flade Isblink.
Terry
Well for some strange reason I'm quietly confident number one is from 2013.
That leads me to wonder what year it was when Neven saw that image, and when exactly number four was taken!
Not knowing the scale of the images, I don't see them as depicting anything ice-shattering. I am interested in what causes image 4 to be the 'one-of-these-things-is-not-like-the-other' image.
Based on the arc of the fractures, image 4 is the result of completely different wind patterns and/or ocean currents must have been significantly different.
This isn't as easy as one would guess! :-) But, I'm going with #1 too, and guessing the order too, #3, #2, #4 and #1. Am I correct in guessing all of these are post-2005? I'm of the same opinion of the location than others.
Kevin - It seems a trifle unsporting to give the game away before the weekend, but you might be interested in searching my blog for the word "polynya".
I'll post the answers and comment about why I've done this tonight.
Although the 'why' is probably quite obvious.
I don't think anyone has the complete set of four right yet. Can I test my theory before you "give the game away" Chris?
I imagine your 'why' is related to the reason I've been constructing a crude "home video" of the region over the last few weeks.
It doesn't seem to be feasible to post images in comments?
Where in the sequence do you reckon this one fits?
http://screencast.com/t/qYGjA22bk
I've posted the answers in my next comment, here.
Jim Hunt,
I don't know why you're producing a video - it'll be interesting to see though.
As you'll see from my answers post - I decided I couldn't figure out how to order the images.
Jyyh,
Yep, all post 2005.
I'm rather a newbie at ice watching Chris. I became intrigued by the appearence of the "Morris Jesup Polynia" last December, and asked myself the same questions as Kevin too. Since then I've been keeping a close eye on this particular area of the Arctic.
The video, such as it is, is an attempt to keep tabs on the large chunks of ice heading out of the Wandel Sea into the Fram Strait. Clouds have an unfortunate habit of getting in the way though! Whether I attempt to repeat the exercise for other years remains to be seen.
As a seasoned Arctic watcher yourself, what do you suppose might cause the strong southerly winds that open up the polynia. Just random weather, or something more amenable to analysis?
Jim,
I don't know, I've not looked into it. If you have some dates when the Polnya opens I can show you how to use NCEP/NCAR which might help.
Is there any connection between dates of opening of the Polnya and the Arctic Oscillation? I ask because I remember the AO index having a role in the opening of the flaw lead along the Arctic Ocean coast of the Canadian Arctic Archipelago. But I can't remember which way it was, whether -ve index lead opens or +ve index lead opens.
Arctic Oscillation data here.
The daily series would be best to use.
I removed the comment by Haj Umrah as it was spam advertising flights and hotels for the Haj pilgrimage.
Hi Chris,
I recognised your first image immediately, because of the big "slabs" of ice lower left in your reversed image, which are in the location occupied by the polynia which opened at the end of November 2012. See the second half of my own post on the topic, which includes details of "the weather" at the time:
http://econnexus.org/the-day-after-tomorrow-coming-soon/
I also recently stumbled across the prior occurrence of the polynia, visible in your fourth image, which started opening up around 8th February 2011. Similar weather.
In my role as an ageing surfer I'm familiar with using ECMWF to follow hurricanes and other storms across the North Atlantic, but north of the Arctic circle is a foreign land to me. Any tips you can offer will be gratefully received! I'll certainly check out the state of the AO at the requisite times.
Thanks for the suggestions.
Thanks Jim,
I'll look at this tomorrow morning.
I've now had a quick look at the AO numbers. To my untrained eye there doesn't seem to be any obvious correlation. AO +ve in Feb 11, but -ve Nov/Dec 12.
Thanks for saving me the time. I've been working on a new post about this Beaufort lead all morning.
I can't see any common large scale pattern between the two periods in NCEP/NCAR. Give these links time to work. Sea Level Pressures on:
30 Nov 2012.
8 Feb 2011
Thanks for saving me some time also. There doesn't even seem to be much of a common small scale pattern either. I guess the local offshore (i.e southerly) winds might be deduced from 2012, but even that is not immediately obvious in 2011.
Back to the drawing board once more I fear!
Yep, that's the way it works out Jim.
For all the successes posted in posts like the 2010 PIOMAS volume loss, the Summer Daze circulation pattern, and Blocking Highs, I follow a lot of blind alleys that lead nowhere.
If I think of anything I'll give you a shout.
Post a Comment