PIOMAS stands for 'Pan Arctic Ice Ocean Modelling and Assimilation System'. It is an assimilating model of Arctic sea ice. 'Assimilating' means that it takes in observationally based atmospheric drivers, from NCEP/NCAR (e.g. wind, surface temperature), and uses that to drive the ice and ocean components. This is to be contrasted with free-running GCMs that generate their own weather which can differ from the weather experienced in the real world.
The source data is compiled from PIOMAS gridded data, which is available here, thanks for Dr Zhang and the PIOMAS team for making it publicly available. New years are added early in the following year, so the data only runs until 2012. There is no grid box area data available there, but Wipneus has calculated a grid of grid box areas and made it public here. Rob Dekker has saved me the (slight) bother of converting to the same file format used by Dr Zhang, this means my programme can use the same input method for loading grid data as it does for loading variables such as grid box ice thickness/concentration etc. If you need a copy of that single precision binary table just email me (Chris886222 at btinternet.com), if I don't reply within a couple of days prompt me here (spam filter can be over enthusiastic). The tables have been error checked by comparing with the monthly averages of the daily series issued by the PIOMAS team here.
The method used to generate this data is simple. I go through each grid box that contains ice (thickness > 0), use the grid box thickness to assign that grid box to a thickness category, and add the volume for that grid box to the overall sum of volume for the relevant thickness category. This gives the volume of the ice that is accounted for by various thickness categories. Categories run from 0m in 0.25m 'buckets', however note that as only grid boxes of greater than zero metres are used the first category leaves out grid boxes of zero, which would have a volume of zero anyway. The final category, 3.5m is grid ice thickness of 3.5m or thicker.
Note that these are grid box thicknesses, which can be viewed as average thickness for the grid box. A grid box will contain ice that is thicker and thinner that its average.
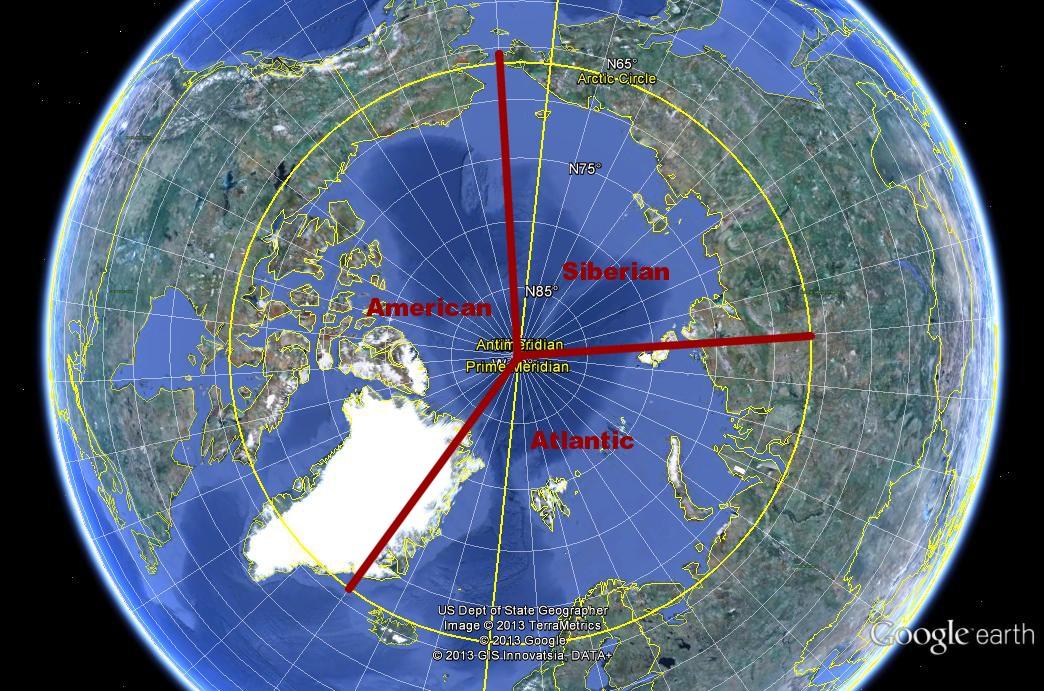
I have now calculated four breakdowns. In an earlier post I introduced three regions of the Arctic (N of 65degN latitude), however to ensure these breakdowns tally with the overall PIOMAS daily series I have used the same regions for this data, but I have not applied the Arctic criteria, i.e, the region splits are based on longitude alone.
The regions are: Atlantic: 330.000 to 99.999 deg longitude. Siberian: 100.000 to 189.999 deg longitude. American: 190.000 to 329.999 deg longitude. These are illustrated in the graphic below, but the lower latitude is down to 45degN latitude, not 65degN. 45degN is the lower edge of the PIOMAS domain.
The data is provided as comma seperated values, so by copying and pasting into Excel then using 'Text to Columns' under the Data tab, you should be up and running quickly. The datasets are:
All PIOMAS Domain
Atlantic Sector.
Siberian Sector.
American Sector.
This data is now available in an Excel Spreadsheet.
Comments are closed on those pages, but comments open here for any questions, comments, or suggestions.
No comments:
Post a Comment