The following is figure 1 from the paper, this conveys their key findings graphically.

Figure 1 of Zhang et al, 2008, "Recent radical shifts of atmospheric circulations and rapid changes in Arctic climate system."
In the above figure the panels show the first EOF (dominant mode of atmospheric variability) for six consecutive periods, the percentage above each panel is the amount of variance in the period that the dominant mode accounts for. The first 5 panels show changes in the Arctic Oscillation (AO) over the period 1987 to 2002. The final shows the emergence of the AD as a dominant mode.
It is notable that the centre of action of the AO shifts northeastwards, having originally been over the Icelandic Sea. The shift is stated to be related the observed poleward shift of storm tracks and intensification of Arctic storm activity. I'm still trying to reconcile this finding with the apparently counter-intuitive finding that atmospheric heat flux into the Arctic has decreased since the 1980s (Smedsrud et al). In the previous post I mentioned that the AO and Fram Strait ice flux only show a correlation after the 1970s. In view of that it would be intersting to see what changes there were in the AO prior to the 1980s, such changes in the centre of action may explain the change in AO/Fram-ice-flux correlation.
Zhang et al find that the AO robustly explains most of the variance (over 20%) over most of the period that they consider, previously I noted that Wu et al 2006 stated the AO accounted for around 60% of variance. However from 2002 onwards the AD becomes the dominant mode, explaining 21% of the variance. It's worth noting here that Zhang et al's use of EOFs over small windows as opposed to Wu et al's EOF over a long period should (as I understand it) bias the amount of variance accounted for in Zhang et al downwards. When a longer dataset is considered short periods of random fluctuations are in a sense averaged out, so the findings of Zhang should as I understand it be considered more conservative than those of Wu et al (If you're reading this and can correct my best guess please feel free to enlighten me).
Zhang et al propose that this shift to the AD, and the AD pattern itself, marks an unprecedented climate change signature. Wu et al found that the AD, although less dominant and explaining only 13% of variance, was visible as the second leading mode in the Arctic's climate: So I would question the novelty of the AD because it was present in the 20th century. However the shift to a dominant AD does seem to be a new and important signature of climate change. It's worth noting here that the AD pattern of Zhang et al apparently differs from the pattern described in Wu et al, however this may be because Wu et al consider a longer period than the time windows used by Zhang et al, and Zhang et al are considering the AD's move to dominance, Wu et al's AD was in the second not the first leading mode.
Zhang et al examine the correlation between the AD, temperature and sea-ice changes. They find that when the AD is negative it draws air from the Atlantic into the Atlantic sector of the ice-pack, this notably causes a negative correlation between temperature at Longyearbyen (Svalbard) and the AD. They also carry out a lagged correlation test on sea ice anomalies in the summer with the preceding winter's AD index and find a significant decrease in sea-ice in the Barents, Kara and Laptev seas with a preceding winter's negative AD index this fits with the findings of Wu et al as discussed in the preceding AD post. Zhang et al's figure 2 also shows that with a negative AD there is an impact of cooling and increase of sea-ice in the Pacific sector over the period 2002 to 2007. In contrast Wang et al show that the greatest impact upon sea-ice is with the positive AD mode, this is supported by a later paper which I'll cover in my next post.
Furthermore Zhang et al present a timeseries of the amplitude of the AD from 2001 to 2007. This shows that the AD had a downward trend from Winter 2001/2 until winter 2005/6, when it began an upward trend into a positive index leading up to the crash of 2007. The AD seems to have been the key player in the both preconditioning and the anomalous high and Fram Strait export of of 2007. Other research supports this contention, so this raises the probability of further crashes like 2007. However we are in the early throes of a new atmospheric regime in the Arctic, so it cannot yet be said how often and how persistent such extreme positive AD phases will be. Furthermore as this year is certainly showing, the sea ice, being thinner than in the past, is more responsive to atmospheric impacts.
So we now seem to have a plausible physical reason to home in on the the year 2002 as a feasible breakpoint in assessing Arctic trends, as we now see the emergence to dominance of an old, formerly secondary, atmospheric player. It's been obvious that the summer sea ice extent loss is accelerating and often people fit non linear curves to the decline. But I thought it interesting to see what happens when I fit linear trends using 2002 as a breakpoint. The Arctic Dipole should change the rate of loss as it becomes dominant because it affects ocean, and atmosphere heat fluxes and directly impacts sea ice transport.
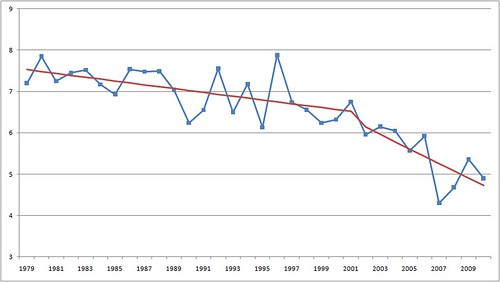
Trends in September Average sea-ice extent. Blue line, NSIDC September average sea-ice extent. Red line, pre and post 2002 trends. Data from NSIDC.
1979 to 2001 is period 1, 2002 to 2010 is period 2. From Excel (Linest and Fdist functions): Period 1 has a slope of -0.046M km^2, r2 of 0.33, probability that the trend is by chance 0.0038. Period 1 has a slope of -0.177M km^2, r2 of 0.53, probability that the trend is by chance 0.0054. The loss rate in period 2 is almost 4 times the loss rate in period 1.
NB - See comments regarding the following paragraph.
Recently over at Neven's Sea Ice Blog, Seke Rob, one of the posters, has revealed a stunning graphic of variation of days at certain levels of extent through the melt season. You can view the image here, I've deliberately not done it as a graphic in this post because it needs higher resolution than my blog will comfortably accomodate. Firstly the days of the year are shown as a day count on the X axis, the Y axis are years, the graph shows the progression of each year. The coloured bars for each year are the number of days in a certain band of sea-ice extent. So starting from the bottom green (less than 12 million kmsq) is around day 160 - 175, 20 years on, 1999 and it's moved on to between days 145 and 160. But move up a bit further and you'll see a jump in 2003 a jump that's sustained for the following years. Is there a connection between this and the findings of Zhang et al?
In a previous post I discussed Hakkinen et al's findings of an increase in sea-ice drift due to increase in the speed of the transpolar drift and the action of increased storms. Their figure 1 shows a long term trend of increase in speeds, however the summer speeds in particular have an apparent jump in speeds, again this is after 2002, although other evidence does not show a trend in the AD after 2002, despite it's rise to dominance.
I've already touched on the impact of the AD on the sea-ice, but there is one very useful paper that covers this excellently and I'll address it in my next post in this series.
Lars Smedsrud et al, 2008, "Recent and Future Changes of the Arctic sea-ice cover."
http://www.folk.uib.no/gbsag/Smedsrud_etal_2008.pdf
Bingyi Wu et al, 2005, "Dipole Anomaly in the Winter Arctic Atmosphere and its Association with Sea Ice Motion."
http://www.atmos.washington.edu/~dennis/WuWangWalsh_Arctic_06.pdf
Xiangdong Zhang et al, 2008, "Recent radical shifts of atmospheric circulations and rapid changes in Arctic climate system."
8 comments:
I'd be careful about reading too much into the change in 2003 in Seke Rob's graph. If I understand right, he's using both NSIDC and JAXA data, and the switch between the two is in 2002/03.
If I've misunderstood, then I apologise!
Peter/Chris, plz see the footnote in the chart [always been there]. During the overlay period of both products, the difference mean was ~3 +/-2 days between the NSIDC and JAXA products and from 2003 to 2007 AND the further into the melt year the difference slim to below ~2 days. You be the judge of the significance of that, but don't think the picture should be assessed in isolation to other data, winter extent for one.
For seeing the NSIDC/JAXA date differentials, refer to the separate charts I've shared over at Neven's, for the 10M 9M 7M and 6M. For latter there being actually too few data-points, but enough to see that there's *no* significance left IMO. ArcticSIE1stDay6Million
More interesting to me in that latter chart is the step change of SIA per CT data... look at the inter-annual before 1998 and then on. Other charts display the divergence of SIA and SIE, and the Extent Quality Indicator or Breakup Index as I consider it too, which done on different datasets based elsewhere is called CAPIE.
Per AWI March sensor flight measurement, the Beaufort had just 140cm left on FYI, where 2010 showed 160cm and 2009 170cm. Think that counts significantly and even with less optimal weather will go, given the relative high salt content of that, wherever that FYI got transported this season.
-- SekeRob
Thanks Peter,
Seke Rob,
Thanks for the info, I note that the graph has been changed (it no longer looks like the one I linked to). Yes I was aware of the note, it confirmed what I already knew, but I didn't know the datasets had changed in 2003.
I'm too busy to give this matter the time it requires right now so I'll reply again over the weekend.
Chris,
Yes, the chart is dynamic. I've expanded the steps, now 16M to 5M and of course, with 6M scaled for 2011, the road to the 5M bar has started building. The splice point is July 2002, but maybe for a few days shift, nothing big. Sorry for that not being clear, so I'll add a note to the legend when revisiting.
The plan is still to make one also with GSFC data that go back to 1972, mostly for my own satisfaction. Also one against Area and that can be done with a single dataset. Those take time, me own.
--SekeRob
I ran into this page and found this interesting posting. Following the discussions here, I read the two papers by Zhang et al. and Wu et al. I believe there is a misunderstanding or misinterpretation of Zhang et al.'s and Wu et al.'s findings. Zhang et al.'s "Arctic Rapid change Pattern (ARP)" is completely different from Wu et al.'s AD:
1. ARP is a hemispheric phenomenon, but AD is not.
2. ARP is the leading mode that explains >20% of total variance but AD is the second mode that only explains 13% of total variance.
3. ARP and AD have completely different physics as indicated by the composite analysis of sea level pressure. ARP has one variability center in the North Pacific and Beaufort Sea and the other in Eurasia (Figure S1 in Auxiliary Materials, Zhang et al. (2008)), while AD has one center in the Laptev Sea and the other in the Icelandic Sea (Figure 5, Wu et al. (2006)).
Hi Anonymous,
Not got time to re-read the papers right now. But from memory regarding your points...
1) Different studies cover different extents, however the AD does have a wider hemispheric reach as shown by Wu et al
http://www.soest.hawaii.edu/MET/Faculty/bwang/bw/paper/193_WuZhang_Wang_Sea_ice.pdf
That is the same Bingyi Wu as the paper ref'd in the post.
Here's what Overland & Wang have to say about the differences in patterns between those studies: "Our EOF3 has a resemblance to the second
EOF/dipole pattern of Wu et al. (2006) and Wang et al. (2009)
where the geostrophic winds are oriented on an Alaskan/Kara
Sea axis. Our EOF2 and the Wang et al. (2009) summer dipole
pattern are oriented more with Fram Strait. Because of the Buell
pattern relationships, a linear combination of the regional EOF2
and EOF3 can represent the dipole /meridional pattern with all
possible orientations."
Ref - "Large-scale atmospheric circulation changes are
associated with the recent loss of Arctic sea ice."
2) As the first figure in the above post shows, the ARP has emerged out of a shift in center of action. So Zhang and Wu's patterns are necessarily different as they cover different periods. Wu finds a dipole pattern in an earlier period to the changes Zhang finds in the emergence to dominance of what they call the ARP. However Overland and Wang (and other researchers seem to view the patterns as part of the same phenomena).
3. This has been largely covered in the above two reply points. However if you look at Overland & Wang you'll see more difference from Zhang and Wu.
I've been failing to see the AD when it was there because I was too doggedly looking for the patterns I'd seen in the literature I've read. All I look for now is a rough pressure dipole with centres generally in Siberia and Greenland/North Canada.
As a result* I now think the AD is the explanation for a pattern I've noted in another post.
http://dosbat.blogspot.co.uk/2011/09/summer-daze.html
* also partly because NSIDC have noted the role of the AD in all summers since 2007.
EOF is a mathematic tool. Its results must be verified by physics. EOF modes can be artifacts without physics. This has been extensively discussed in literature. The composite analysis using Zhang et al.'s ARP clearly shows changes in the observed atmospheric circulation systems, such as Icelandic low, Siberian high, and Aleutian low. But I cannot see what physics Wu et al's EOF2 represents. Overland and Wang clearly shows a arbitrariness of EOF2 and 3, from your reply above. I believe Zhang et al. and Wu et al. discussed different things from physics point of view.
Needless to say I agree that physics must back up the components resulting from EOF analysis. However soemtimes such mathematical analysis reveals patterns and new avenues of research.
On this page:
http://dosbat.blogspot.co.uk/2011/08/arctic-dipole-sea-ice-loss.html
I discuss a paper in which both Zhang and Wu were involved - surely this implies that the authors don't see the difference you do.
That research connects low sea-ice events with the positive mode of the AD, which is defined as the 2nd EOF - the dominant EOF component is the AO, but the period of analysis is 1948 to 2008, so wouldn't reveal the emergence to dominance of Zhang's Arctic Rapid Change pattern. That there is a measureable impact on Arctic sea ice extent strongly implies that the second component from the EOF analysis is not a mere abstraction.
With regards the differences between Zhang and Wu, I can't add anything to my earlier reply, sorry.
Post a Comment