My map-plot of PIOMAS grid box effective thickness shows continued thickening, which is rather trite to note in the autumn.

I noted in my November Status post a thin tongue of ice over 2m thick (blue) levering away from the northern coast of the Canadian Arctic Archipelago (CAA), this feature has thinned out. But there is ongoing thickening into Beaufort and through to the East Siberian Sea (ESS). PIOMAS does have vector data, but I've not as yet had the time to grapple with that (it's rather daunting too), however HYCOM Global does indicate export into that region on top of existing thicker ice there.
By this November the true scale of what I described as a massive volume increase in my September PIOMAS status post is revealed. Using the PIOMAS main series (source) the increase in volume is astonishing. having been at post 2010 volume levels last winter, current volume now rivals 2008!

I have read people expressing their disbelief of these PIOMAS model results, I see no reason to doubt them. Schweiger 2011 gives an uncertainty for October sea ice volume from PIOMAS as +/- 1.35k km^3, this is conservative (a larger range than one might reasonably assume). Taking the PIOMAS main series volume of 13.314k km^3 on 30 November 2014 puts 2014 at roughly the same level as 2008 (13.332k km^3). If one applies a -1.35k km^3 to that 13.314k km^3 then on 30 November the volume would be between 2009 and 2010, but if you do that you are bound to accept that the converse is as likely: that volume may be as high as between 2004 and 2005. When working with an expression of '+/-' uncertainty the door swings both ways.
As usual I will continue to work of the main series figures as given, or the figures given in the gridded data. Note that by 'main series' I mean the data that the Polar Science Centre (mainly Dr Zhang as far as I know) provide for daily and monthly volume. However as regular readers of this blog know, I also do my own calculations from gridded PIOMAS data, some results of which will follow.
Using gridded PIOMAS data I have (as usual) broken down volume into regions, the regions used are the Cryosphere Today regions because these are well know in the amateur sea ice community.

The pattern of regional volume remains that seen throughout the summer, that the volume increase is largely confined to the Central Arctic.
For the whole PIOMAS Domain (north of 45degN) thickness distribution is shown below. Ice volume from grid boxes below 0.9m effective thickness continues to increase, 1 to 1.9m thick volume is up from 2012 but arguably remains part of a recent downward trend. It is from grid boxes between 2m and 3.9m thick that the bulk of the increased volume arises. Thickening beyond such thicknesses is almost totally by ridging and other mechanical deformation due to the insulating properties of sea ice.

This year shows a substantial increase in volume, however the pentad (5 year) averages of thickness distribution demonstrate how much further there is to what could reasonably be considered a recovery of the sea ice (pre 2000s levels).

However in terms of the 2000s the thickness distribution shows a clear high-side bias, due to the higher volume of thicker ice. comparison with individual years post 2010 underlines this.

2010 was a major volume loss event equalling the 2007 loss event, more here. From the above it would seem that the impact of 2010 has turned out to be rather limited, with an increase in volume repairing the damage of that year. However another perspective reveals that this might not be the case.
Now that I have November data it is possible to add one more year onto the series of September to October volume increase, this is an important period because it shows the early season rapid period of volume increase.
But before I go onto that data, Thorndike 1975 provides a graphic of rate of ice thickening as a function of ice thickness.
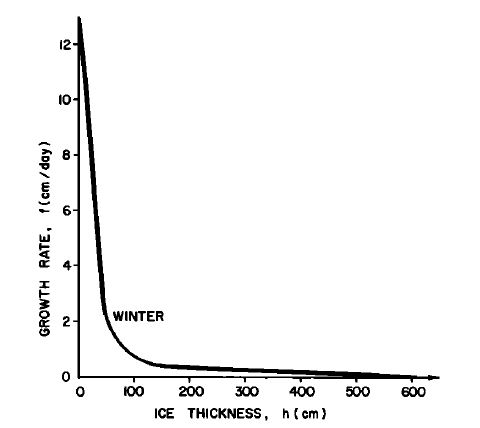
From the above, it is clear that the period of most rapid gain in thickness (hence volume) is when the ice is below around 1m thick. That is the period from September to December for much of the Arctic Ocean ice pack. This is due to heat conduction through ice, a subject I will go into in more detail at some stage in the next few weeks.
For this post I just wanted to show the gain of volume from September to November calculated using gridded PIOMAS data. That could be done with the main series, but the gridded data allows regional decomposition.

From this it is clear that 2010 ushered in a new period of September to November volume gains in excess of 4k km^3, and it is clear that 2014 is still part of the post 2010 group. Prior to this grouping the only year in excess of 4k km^3 volume gain was 2008.
I have used PIOMAS gridded volume data to decompose this volume gain and show percentage contributions to the volume gain from September to November.

After 2010 the Central Arctic (red) shows a large increase in percentage contribution to overall volume gain. 2014, with thicker ice, shows a small drop off. But 2014 still has a large percentage contribution.
Looking at this in absolute terms here are the volume increases from September to November for all regions of the PIOMAS domain, the increase in volume for the 2010 to 2014 average in the Central Arctic is massive.

Now that it is clear that the area of interest is the Central Arctic we can look at the behaviour of volume gain in that region.

In line with my expectations the increased volume has led (through thickness) to reduced volume growth, down to about 3/4 of the highs of 2010, 2011, and 2012. However I would not have guessed that volume growth would be quite so high based on conditions back in September, I had expected 2010's effects to be totally wiped out, yet volume gain remains historically high.
Thickness plays a role in this due to the relationship between thickness and rate of thickening shown from the Thorndike 1975 graphic displayed above. Here is regional thickness for the Arctic Ocean.

The Central Arctic reveals a strong uptick in thickness, in line with expectations based on volume. Has this wiped out the impacts of 2010, on balance I don't think so. But if 2015 is as poor a melt season as 2013 and 2014 I expect that the effect of 2010 will be totally removed.
Before closing I want to look at NSIDC Extent for the most recent data available.

What strikes me most about this is a period of level extent in the early part of the series, then a drop, after which we see another levelling. That levelling at the end of the series seems to coincide with the hiatus in global warming, which started around 2003 (if you think it happened from 1998, you are wrong).
I know others more knowledgeable than I in statistics have made strong arguments against the supposed hiatus in global warming, I still see a hiatus. I'm not a statistician, I'm just an engineer. But when I see readings levelling I presume that regardless of statistical confidence there probably is a levelling, and see things ramp up sharply has made me reach for the off switch, that has saved money (in damaged kit) without reference to statistical significance. Arguing that such a hiatus represents the end of a long term trend is a statistical question, and as Tamino and others have shown repeatedly the hiatus is not a break in the pre-established warming trend.
So if the pattern of decline in the above graph is an AGW driven decline bound by two periods of quiescence, where has the decline come from? Using Wipneus's calculations of regional extent it is possible to answer that.

Two averaging periods are used, the 1980s and the most recent ten year period 2005 to 2014. Central, Beaufort, ESS, Laptev and the CAA all show little or no decline. The decline comes from regions at lower latitudes and in the adjacent northern Pacific and Atlantic Oceans. 54% of the total decline is in the Arctic Ocean, 44% of which comes from Kara, Barents and the Greenland Sea (leaving 10%). Hudson bay, within the North American continent, contributes 25%. In the Pacific Okhostk & Barents contribute only 8% of the total decline, however those regions have seen a 25% drop in extent from 1980s levels by the 2005 to 2014 period. All of which seems to me to be consistent with an AGW driven loss of extent, in tandem with the overall volume decline from 1995 to 2012 within the Arctic Ocean.
11 comments:
I like your posts; read all of them.
A bit confused by your first Figure. It shows Kara as having virtually zero volume in 2014. Though a quick calc. with the current CT area and your Kara average thickness suggests something near 500 km^3.
It's been quick to freeze this year, can't see why it's show as near zero.
Did I miss something?
Anon,
I will double check when I get home, but it's the same code used for the whole of the time series, all regions.
Two things.
That's for all November, not just the last day of November.
You get weird results comparing indices like CTArea and PIOMAS.
Your fifth figure (pentad averages of thickness distribution) is quite fascinating. Unlike 2013, which appears as a reversal in the long-term leftward movement of the distribution peak, 2014 looks more like a bifurcation. The peak seems consistent with the long-term trend, while the middle thickness range shares characteristics of a decade or so ago. There were some signs of this shape emerging in the 2011 distribution (in your sixth graph), but 2014 is more distinct. I can't help seeing the past and future engaged in a massive tug-of-war.
Iceman
I'd see the bifurcation as part of the simple freeze physics (Thorndike graph) described in the post.
If you go back to August post
http://dosbat.blogspot.ca/2014/09/piomas-august-2014.html
You can see the distribution at the end of the melt season. Peak in the 1.2-2.2m thickness. A month or two of refreeze and some of this ice may have thickened and is joined by a new peak (0.8m) which must be the areas of ice formation in what was effectively open water. It looks much more like the product of a portion of ice thats lasted through a couple of weaker melt season in conjunction with normal refreeze processes in open water.
Anon,
Thanks for catching that, I should have spotted the low volumes in recent years. The graph I posted was done for November but on copying and pasting reverted to the September data. This is the second time I have had this problem with Excel.
Anyway, November for Kara is 0.614m thick, the volume is 443.4km^3.
443.4 / 0.000614 = 722325km^2.
This is close to the calculated area of grid cells containing ice in November, which is 437943.5km^2, the difference being about 1%.
There is a difference here because when calculating thickness, in line the the PIOMAS graph of thickness, cells with ice of >0.15m is left out of the calculation of thickness.
Anonymous,
Agreed, thanks for that. Iceman, essentially it's an outcome of the thicker ice being mainly restricted to the Central Arctic region. In the other regions in the periphery of the Arctic Ocean PIOMAS volume was similar to the other post 2007 years, although extent and area were up.
http://dosbat.blogspot.co.uk/2014/10/the-fast-transition.html
So we still see the "monomodal" peak of thermodynamically thickening ice as well as the thickening of the thicker mass of ice.
Oh, Yeah. That looks much better. Kara and Barents both ahead of recent years.
Thanks for all the good work you do.
Hope All I well Chris.
November AMO data came out the other day, Largest November decline since 1933. There have only been 7 November since 1856 where Nov fell .200 or more. 2013 and 2014 are the only 2 November's that ever had back to back .200 declines ever on record.
AMO is trending down and Arctic sea ice trending back up. Reverse Feedback about to occur once AMO goes back to negative phase.
Many are saying 5-7 years but I see it happening in 2015.
1995 went + 2005 was peak and 2015 should go back negative.
Hi NJ Snowfan,
I'm fine, hope you are too.
I presume you'e using the long unsmoothed dataset from PSD?
http://www.esrl.noaa.gov/psd/data/timeseries/AMO/
Let me have a URL if I'm wrong.
Yes, Autumn typically shows a drop in recent years, but sticking with October subtracted from November...
Have you tried graphing them and comparing with the AMO annual average time series? I note that the Nov-October difference reached a similar low in 1931/1933, but this was actually during the rise of the annual average AMO into the 1940s +ve phase. Taking a seven year average shows that period to have been a double peak, I don't think we can rule that out for this cycle peak.
So the AMO may be starting to trend down, but on the basis of what we have (and two cycles is frustratingly short!), I'm not certain it will do so at the moment.
Now the AMO might have a role in the poor melt seasons of 2013 and 2014, and if it is going negative that might have implications for sea ice. But I have yet to read a convincing case that there's a role for the AMO in the 2013/14 melt seasons. And as I showed you last time we chatted, there is a far from convincing relationship between the AMO and the current decline of sea ice, which contrasts against the very good agreement between CO2 and sea ice loss.
If by this time next year we're seeing another volume increase (as per PIOMAS) then I think the AMO might turn out to be a reasonable candidate. However October Cryosat 2 data shows a _drop_ in volume between October 2013 and 2014. And the PIOMAS gain over last year is within the uncertainty for October volume, so strictly speaking we cannot say PIOMAS has shown a gain this year!
That noted I still think there's a gain in volume this year, I don't trust Cryosat 2 yet.
And yes, I will keep following the AMO.
Thanks for the response Chris
Interesting AMO paper here.
http://onlinelibrary.wiley.com/doi/10.1029/2010GL042793/full
JC"s comments are good here
http://www.climatedialogue.org/melting-of-the-arctic-sea-ice/
Few charts I posted today are here https://twitter.com/NJSnowFan/status/545336804443164672/photo/1
What moves first, the AMO or surface temps you think. Spike in the PDO is having big effect on Sea ice growth and Chukchi sea I see. Don't look like it is going to end up thick and will melt out fast in the spring. Next year though will be a different story because PDO will be heading down with Solar. https://twitter.com/NJSnowFan/status/545212747622146048
Why do I feel the PDO will track solar, well it did with the lower cycle during the 1970 also.
History repeating.
Have a good day and Happy Holidays to you and Family.
Regards the Chylek paper, they detrend before finding the 'see-saw' so I don't see how this can be informative about the impact of CO2 and anthropogenic GW on sea ice. The issue reminds me of a paper that took the derivative of global temperature and found a strong role for the ENSO. This was then touted around the 'net as showing that the ENSO drives global warming. Of course when one takes the derivative one removes the trend of increase so all that paper did was show a role for the ENSO as variations imposed on the trend of anthropogenic global warming. Likewise Chylek seemed to find an underlying factor of possible oscillation superimposed on the global warming driven trend.
However in the case of the ENSO paper they had loads of 'cycles', in the case of the Chylek see-saw the results remain dubious because they have but two apparent cycles, and it's hard to be sure one has removed the effect of the global warming happening during the latter period.
I read that exchange some time ago. Dr Curry has a long history in sea ice, however on this I think she is wrong from a practical point of view. Yes amplifying factors such as ice albedo feedback drive most of the volume loss. But the results of GCMs show no ice loss without anthropogenic forcing (e.g. Overland & Wang). Therefore the issue is not to disentangle the relative roles of natural variability and amplifying feedbacks, but to step back and see the wood for the trees - human driven global warming is driving the loss of sea ice.
The next few years will show whether the AMO/PDO has had a large role in the volume loss of the last 20 years. I think we need to be patient and let the natural process teach us.
I hope you have a good holiday too. Four more days of work then the firm shuts down until the New Year.
Post a Comment