This slow start began in May, and was probably in large part due to anomalously cold temperatures across the pack.
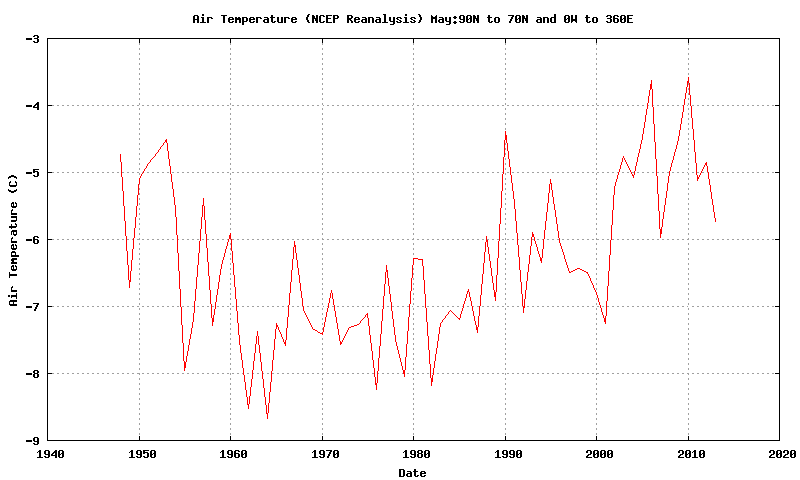
That plot was done for the area north of 70degN, however this includes a bite of the Atlantic Ocean, to remove this the following plots are for 90degE latitude to the Greenwich Meridion (360deg) north of 70degN.
Like May, temperatures in June have been anomalously cold.

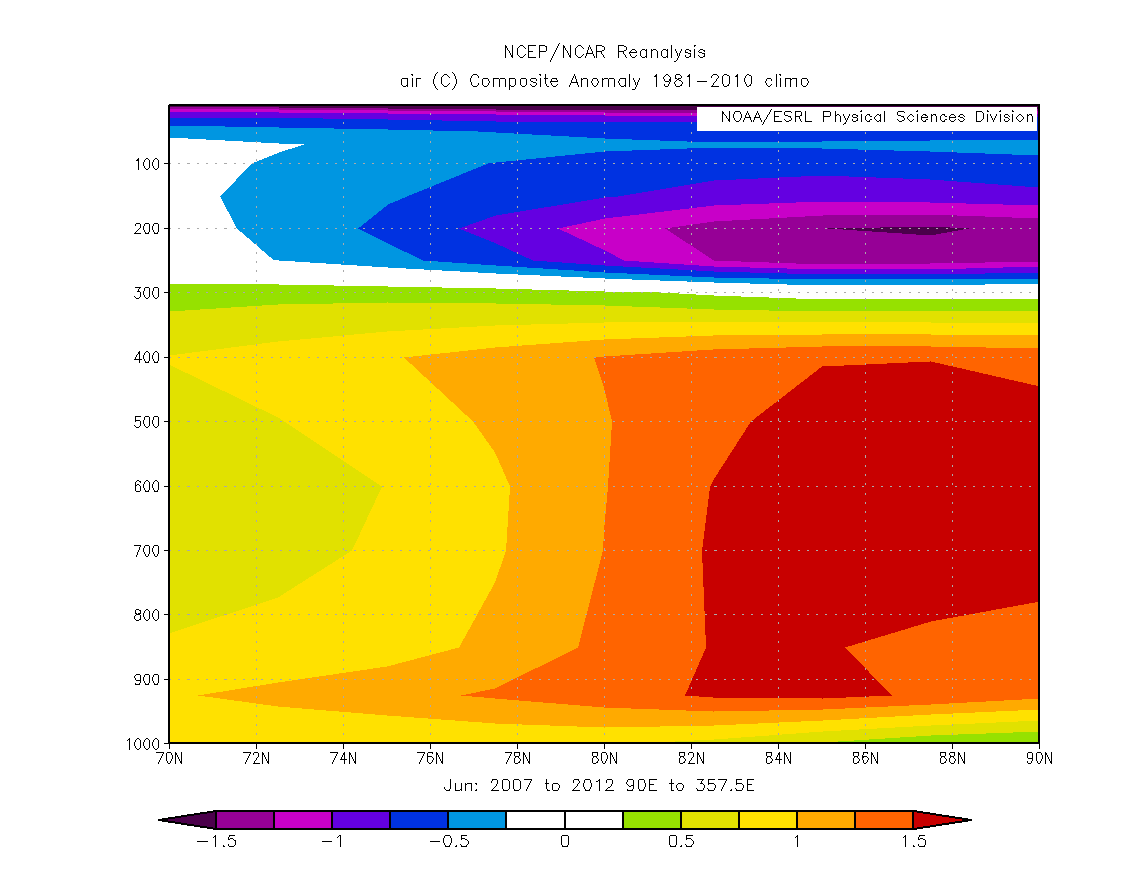
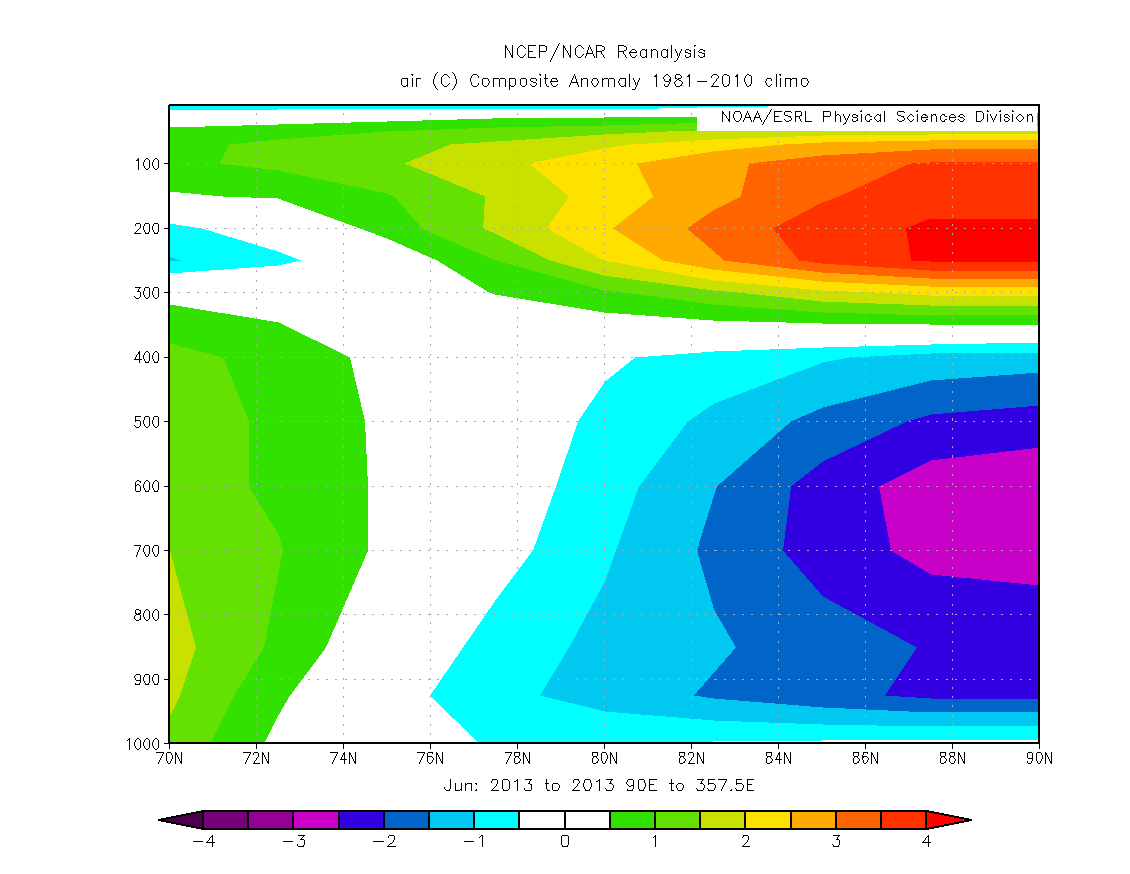

2013 does look like the inverse of the typical pattern of temperature for 2007 to 2012. I stated in the previous post that I thought the best interpretation of 2013's SLP fields was that it was more like the sort of pattern that occurred pre-2007, rather than being seen as the inverse of the 2007 to 2012 pattern. Now I have been able to see the temperature (this data only updated today), I am more in favour of viewing 2013's atmospheric set up as indeed being the inverse of the typical set up for 2007 to 2012.
The proximate cause of this temperature difference is the pressure difference.

One issue with regards sea ice and the dominant pressure over the Arctic Ocean is sea ice movement. In the northern hemisphere the spin of the earth causes net water movement to be at 90 degrees to the right of wind direction (Ekman Transport). Air circulates clockwise around a region of high pressure, so net water movement is towards the centre of a high pressure. Conversely air circulates counter-clockwise around a low pressure region, so net water movement is away from the low pressure centre. Ice doesn't move at 90 degrees to the right of wind movement, it moves at an angle between 90 degrees and the wind direction, but despite this a high pressure region forces a net convergence of ice into a high pressure region, and a low pressure region forces a net divergence away from the low pressure centre. Given that June has had dominant low pressure across the pack, the net movement should be towards the coasts of the Arctic. This may be part of the explanation as to why area and extent have failed to fall as much as might be expected based on previous years, given the high pressure dominant in previous years when net movement would convergent away from the coasts.
Atmospheric temperature and sea level pressure are however just the proximate causes, the crucial question is; why is June 2013 such an odd-ball in the context of post 2007 Junes?
In 'The recent shift in early summer Arctic atmospheric circulation', Overland et al identify a post 2007 shift in wind patterns in the Arctic that forms a dipole anomaly, with low pressure over the Siberian side, and high pressure on the North American side. This paper was inspired by Hanna's work on Greenland mass balance and the Greenland Blocking index, Hanna being one of a handful of researchers who first identified anomalous geopotential height (GPH) ridging over Greenland post 2007. Both of these lines of research describe the local effects of what I have found to be a wider pattern covering a large swath of the Northern Hemisphere at a typical distance of 3000km from the initiating Greenland GPH ridging.
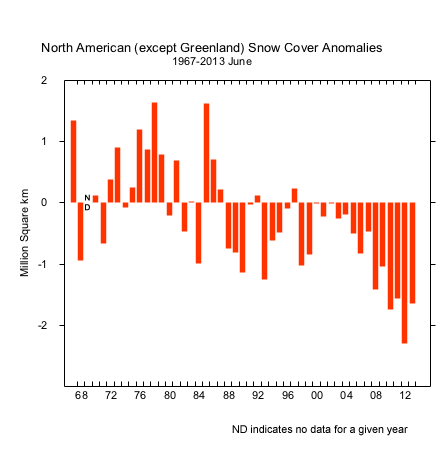
I have found Overland et al's tentative suggestion that the Arctic dipole and Greenland ridging were caused by snow line recession persuasive. So rather than sea ice driving the atmosphere, it seemed feasible that snowline retreat in the post 2007 warming drove a Greenland GPH ridge, which formed a dipole anomaly, which enhanced melt and lead to the greater area losses during the melt season post 2007. Although admittedly an additional factor here would be the thinning of the ice post 2007 and increasing open water formation efficiency. But leaving that issue aside, as I am trying to wrestle some sense out of the atmospheric observations, what of snow line retreat this year compared to other post 2007 years?
Rutger's Snowlab now has June data available, link.


So if not the snowline then what? Looking at the AO/NAO is pointlessly circular, the ENSO isn't doing anything really abnormal, and the other indices I've looked at don't seem to be either. There is one idea that the current status may support, the idea of Wayne Davidson, that there has been a shift in the 'cold pole' to Greenland, and this is what has caused the anomalous ridging in post 2007 years. My idea is that if he's correct then the cold start in May could have stopped the formation of the Greenland GPH ridge and the cold pole shift out of the Arctic. Possibly against that stands the fact that in May 2007 temperatures were similar to 2013, then warmed up in June and the ridging formed. At best this view does not seem to explain why the ridge of the past six years has failed to form.
There are however some implications of the atmospheric set up, should it persist.
- Hanna "The influence of North Atlantic atmospheric and oceanic forcing effects on 1900–2010 Greenland summer climate and ice melt/runoff" find a "strong statistical relation between GBI (Greenland Blocking Index) and GrIS runoff," Without a ridge there is no blocking, and during June there has been no ridge, there has been a trough. So Greenland run off should not be as high as in recent years.
- While the CT Area loss between 30 June and the minimum in September has no trend, most of the post 2007 years are above the trend line (a flat trend) by approximately 500k km^2, I suspect this is in part due to the dipole anomaly. So should the current situation persist we can expect not to lose this extra ~500k throughout the summer as there would be no dipole formed.
- The UK has been plagued by cool wet summers since 2007 culminating in the record wet summer of 2012. If the current atmospheric set up continues there is a good chance of the low pressures of those years being replaced by high pressure, and increased likelihood of an assertion of the Azores High for periods later this summer. In other words, we (in the UK) may be set for a long hot summer.
But all of these depend on whether the anomalous Greenland ridge fails to occur and as I am no nearer figuring out what causes that, or what has caused its failure in June 2013, I am unable to say what will happen.
Having previously expected a new record, I am now highly sceptical of claims we will see new records set in sea ice this year, and part of this scepticism is founded on what I have outlined in these posts on the current atmospheric state. But despite the lack of prospect of a new record, what is happening in the atmosphere alone makes this an unusually exciting year, and that's before I get round to enjoying watching what will unfold between Laptev and the North Pole.
7 comments:
Chris - the DMI temps are not due to a change in weather.
A simple thought experiment a la Tietsche et al: If we could immediately and simultaneously remove all the ice north of 80 what would the surface measurements read?
Wouldn't they all be at or near the freezing point of the ocean water - approximately -1.8C?
This year has seen anomalous low concentrations north of 80 and anomalous DMI temperatures. I think many have missed the obvious correlation and in this case there is a very physical reason to believe the correlation is also causation.
I may be being a bit slow here but I don't follow.
If we removed the ice temperature would shoot up to well over 0 degC because energy wouldn't be going into melting ice.
I think the temperature profiles with height show that the difference this year is lack of heat from the atmosphere. The depth of low level cooling is too thick for it to be due to surface conditions. As contrasted to the typical autumn warming we've been seeing.
I'm convinced the failure of the summer pattern so far is an exciting opportunity to explore that issue, so I'm working on getting to grips with NCEP/NCAR netcdf data. I'd like to see if I can develop an index to allow correlation analysis using this year as a control.
Chris - the ocean is at -1.8C so that would be the surface temperature if we removed the ice. Only over time would it increase/decrease in temperature depending on the energy flux (time of year) that we removed the cover.
A freshwater ice-bath has a temperature of 0C. A saltwater ice-bath has a temperature of -1.8C
In the past N80 has been nearly solid cover with very little ocean exposed to the atmosphere. The temperatures have been constrained by the melting point of the freshwater snow on top of the ice near 0C. In addition, the ice was typically MYI - so the ice near the surface was typically close to being fresh as well.
This year, instead of a near solid layer of ice covered with snow we have a saltwater ice-bath. This is trying to constrain the temperatures to -1.8C.
The result is a DMI graph that is hovering between these two values.
To believe otherwise is to say there has not been *one day* since the onset of melt where the DMI N80 weather has been above normal - not one. In addition, the weather has been almost uniformly 1 degree below normal each and every day.
But what would that even mean? The historical DMI N80 temps are themselves constrained by the melting snow/ice. We don't even know what 1 degree below normal would be. At peak insolation - levels approaching that of the Sahara Desert - DMI barely rises a degree or two above zero. Meanwhile this year there apparently wasn't enough insolation to even *reach* the constraint limit. And apparently hasn't been able to reach the constraint limit for the entire melt season.
That's just non-sensical.
It's a much neater, tidier and more plausible explanation to believe the constraint limit has moved - and there's a visible and physical process to explain why the constraint limit moved.
I get you now, and agree.
Chris, the weather north of 80 has to vary year to year during the melt season. I don't believe DMI N80 temps are any real indication of the weather during the melt season.
I wish I had a firmer grasp of the thermodynamics involved. The ice leaves winter with a thermal gradient more negative at the surface. By summer that gradient has reversed and the surface is more positive.
There is also a transition period visible on the DMI graphs at approximately -14C (260K). Per Wayne Davidson, this is the beginning of bottom melt. Once the transition is complete DMI temps become smoothed. The process is reversed in the fall.
The smoothing process has to be the result of the seasonal insolation curve, the sea ice's thermal gradient, and the presence of bottom melt.
Now that I've convinced myself of the saltwater bath theory I have qualms about it. Is it possible to simply put a two or three day delay into the system early on? I don't think this likely. But after perusing the DMI dataset again I noticed 2004. It is very similar to 2013. Yet concentration maps from CT don't show any low concentrations in the N80 region for 2004.
Yet the large areas of open water in N80 have to affect the surface temperatures - how can they not :)
I'll think about it.
I still can't think of a way to cut through it. Will return to this is I do manage to figure it out.
I'm now less convinced because of the cooling up to the mid troposphere. It seems to me to be compelling evidence that there is simply an influx of cold air that hasn't occurred in other recent years. But that doesn't necessarily mean it's the major role in the surface cooling.
Post a Comment