I've been thinking about the relationship between volume and area, so I plotted a scatter plot of PIOMAS volume at annual minimum and CT area at annual minimum. I can't believe I've not done this before, or if I have that I've forgotten, not having seen the significance.

What initially fascinated me is the linearity, despite all the complexity of changes over the last 34 years, it's so damned linear. So the apparent acceleration of volume loss is closely tied to that of area.
I've extended that curve to zero volume for a purpose. This relationship that has held for 34 years must cease, because if maintained when the area at minimum is at 1.82M km^2 volume will be zero! This is impossible! It's worth noting here that this year's minimum was 2.234M km^2.
Crucial to answering how this relationship will fail is, I suspect, the answer to the question: Why there is a constant of proportionality of 0.222 between area and volume? I should stress that vague terms like crash aren't what I'm taking about when I say 'how', I'm thinking more about the physical processes.
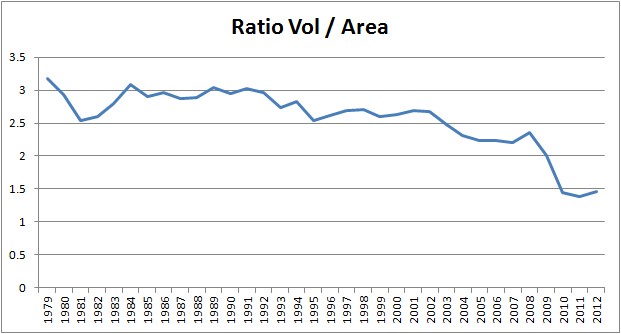
Also relevant to this is the ratio of area and volume.

The jump in ratio at the end of the series is due to the volume loss of 2010. But before I start rambling on about the importance of that year...
It might seem puzzling that the ratio can jump, while the linear trend in the first graphic still holds. If you subtract the offset 1.8224 from area then the ratio is closer to 0.222, indeed the average of all the year's ratios is 0.221388, so that jump is due to volume and can be seen in the first graphic as the last three points being separated from the previous group of three (2007 to 2009) both groups being separated from the pre 2006 mass of data points. But despite the magnitude of the 2007 and 2010 events they have not caused a break away from the relationship shown in the first graphic and a deviation towards a trend that intersects the zero volume = zero area origin.
Which makes me wonder what sort of magnitude of event we face.
PS - I should have waited before posting, I'm too tired and have missed the bleedin' obvious! If you invert the relationship Area/Vol you get Vol/Area, which is thickness, I think that the problem with physical implausibility of the first graphic is due to us being on the edge of critical thickness, below which the ice cannot survive. I'm trying to pin down a figure for such a threshold or reconcile a trajectory between where graphic one leaves off and zero.
PS2 - Plot of Volume/Area which is thickness at minimum.
With reference to the PIOMAS thickness plots at the end of this post. I am now wondering if the deviation implied by the first graphic of this post could actually be relatively slow. With the ice in the interior surviving for some years. The first graphic of this post tells us nothing about rate, and both the 2007 and 2010 events were driven by anomalous weather.
First graphic redone as Volume/Area.

Final PS.
I'll be going over this some more, but have made some progress. Over at Neven's Sea Ice Blog I'm discussing this issue, as I went over there to ask for opinions. My latest new information is here, but the rest of the discussion is worth browsing.
Data - PIOMAS volume and Cryosphere Today Area.
10 comments:
Chris,
As we approach zero point (or even virtually zero point) the inverse logarithm will show up. It will be a rapid roll off, looking something like this:
http://algebra.freehomeworkmathhelp.com/Relations_and_Functions/Logarithms/logarithm.PNG
It still looks linear but will curve and roll off rapidly at the end.
R Gates,
Yes, that's what I'm starting to think. I've gone from thinking sometime late next decade, to possibly this decade. And as a result of the work I've been doing with PIOMAS and CT Area I'm now strongly suspecting a rapid crash out like that. But until I have a better grasp of what's going on, I still think there's a chance it could be slower - until I understand ruling out slow isn't sound. But my gut feeling says it'll be something amazing.
Wipneus has observed this relationship previously, here.
" But my gut feeling says it'll be something amazing."
_____
There are other adjectives I could find for the rapid approach of an ice-free Arctic. Amazing it will be, much like the approach of a high-speed train when you looking right into the locomotive's headlight. And then a bit of terror sets in...
The behaviour of those plots looked somewhat familiar, so I dusted off some maths textbooks and found that the asymptote to an nth order polynomial divided by an (n-1)th order polynomial. ex. a*t^3/(t^2+b)
Then I was wondering about the physical implications. the slope seems to suggest a limit to the average thickness of the ice. The sudden drop in area required to make this meaningful may suggest, as you mentioned, a minimum thickness, beyond which the ice cannot survive.
The next 2-6 years should give us a definite answer.
*found that the asymptote to ... has similar properties to the trend line for Volume/Area.
Sunkensheep,
Thanks for that. I'm thinking along the lines of a critical thickness. However this data holds no information about rate per se. The reason I think it implies a rapid transition is that once the trajectory starts to deviate towards zero it implies increased rate of area loss for a given volume loss. So if we assume that there is a given energy budget for ice melt (one that will be amplified by more open water), then the expenditure of the same energy budget as in past years will imply a greater loss of area than in previous years.
R Gates,
For myself, the word 'awe' is perhaps more appropriate than 'terror'.
"0.22" relates the height of column of ice to the area of its base at 0C (after everything has come to equilibrium.) It holds for ice on land also. However the bottom of land ice can be colder, but the bottom of sea ice is always at its melting point. Thus, if you want your ice sculpture to stand there all winter, you need to keep it colder.
Chris, I am a new comentator but I follow your blog since a long time now. I was thinking also about the same thing here : http://www.forums.meteobelgium.be/index.php?s=&showtopic=1852&view=findpost&p=452888 (sorry, it's french ^^ ). I think there is a limit for the minimum thickness, below which the integrity of the sea ice can no longer be guaranted. The pack is able to disperse and small floe, and this dispersion maximise the ratio surface/volume for individual floe, which maximise the heatsfer (as you know, heat transfer is more a function of surface and heat capacity of volume).
Hi Anon,
I hope it's a blog that continues to be worth following. And thanks for writing in English, I wish my French was up to your standard! But it's not. ;)
Over at Neven's I've broken the Vol/Area plot into contributions from FYI and MYI using thickness as a proxy. It turns out that most of the slope of the trend is due to MYI (multi-year ice), which has virtually been eliminated from the Arctic in PIOMAS. Now we're left with FYI (First year ice) and young ice. This has very little downward trend because it is able to recover quickly. I had been wondering aloud whether this means we face a slow transition.
But after thinking about it today at work I don't think so. I'll post more detail, but not tonight. However - as of the end of December we're 1M km^3 volume below 2010 and 2011 at the same time. Volume anomalies tend to be static from now until the maximum. After which we have the crash in anomalies due to massive volume loss above the seasonal cycle from April to July. So I anticipate that next year stands a good chance of being around 2.3M km^3 volume at minimum, which will imply a further crash in area. I will post more detail but after the last four or five days working solid I need to reclaim some evenings for myself. So knowing me it will be over the weekend.
Post a Comment