Following my earlier post on the PIOMAS volume loss of 2010 I was digging further into whether there might be an atmospheric driver for the ensuing change in the PIOMAS seasonal cycle. I've discovered that there may be, although it's hard to separate cause and effect. In my searches I discovered that there was a new paper on Dr Jennifer Francis's publications page, the paper was entitled "The Recent Shift in Early Summer Arctic Atmospheric Circulation." Due to the change in PIOMAS seasonal cycle, with increasing calculated thickness loss over the summer the title of the paper made me ask myself if this had any bearing on the volume loss in 2010. So I emailed Dr Francis to ask if by 'recent' they meant after 2010. It turned out it was after 2007, and it had more to do with the pattern I found last year in the post Summer Daze.
I have discussed this matter with Dr Francis, and am grateful for her comments and the provision of several papers, including pre-publication sight of the new paper. However, this is my blog post, and my contact with Dr Francis does not imply that she or her colleagues endorse my understanding.
Almost inevitably, this pattern I'd seen had also caught the attention of other scientists who were not aware of my blog post. Dr Francis sent me a copy of a paper by Dr Edward Hanna and colleagues published early this year. Dr Hanna was studying the role different atmospheric and oceanic factors played in run off from the Greenland ice sheet. In the course of their study they found that run off from the ice sheet is most strongly correlated with the Greenland Blocking Index (GBI). The GBI being an index of atmospheric blocking over Greenland due to stationary and persistent high pressure. They found that since 2007 there has been a notable increase in GBI, which is effectively what I have found using another method in Summer Daze, the key issue from that being that the new summer pattern in sea level pressure is centred on Greenland.
Hanna has joined forces with Overland, Francis and Wang to examine this behaviour of the GBI. Overland and Wang have produced several important papers on changes in the Arctic atmosphere, and with Francis co-authoring a paper "Evidence linking Arctic amplification to extreme weather in mid-latitudes" earlier this year, her work seems to have been highly relevant to this issue.
The Arctic dipole is calculated using empirical orthogonal functions (EOFs), which is basically a mathematical technique for extracting patterns in order of their contribution to the overall data. The most significant EOF is that describing the Arctic Oscillation, which produces a flow around the pole due to the polar vortex, which in turn is a consequence of the spin of the Earth. Because the polar vortex cycles air around the pole it has a tendency to keep cold air collected at the pole, and reduce mixing with warmer lower latitude air. The second most significant EOF has in recent years become more prevalent, it is called the Arctic Dipole (AD). In contrast to the Arctic Oscillation the AD draws air across the pole, so rather than keeping the pole cool in its pool of cold air, the AD draws warmer air across the Arctic basin from lower latitudes.
The Arctic Dipole was first identified by Wu, more here, as the second EOF during the latter part of the 20th Century. Zhang later found that in the 21st Century the AD had moved from a secondary role to a more dominant one, more here. Jia Wang (not Muyin Wang, co author on the Overland 2012 paper) showed that the AD has a strong role in sea ice loss events from the 1990s into the 2000s, more here.
In the past I've been using Wu's definition of AD index, that the index is positive with when pressure over the Canadian Arctic Archipelago (CAA) and Greenland is high, and pressure over the Siberian sector is low. Now however Overland, who seems to be running the lead in this issue, has for several papers used the opposite definition. So from now on I'll be using Overland's definition.
Here is the timeseries of the AD index for June. The vertical axis is in standard deviations.
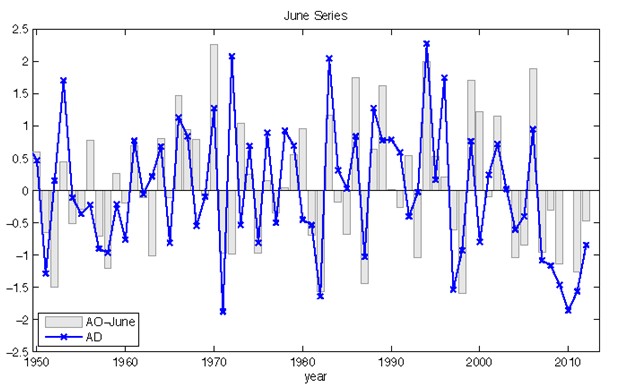
Timeseries of June AD index from reference 2, figure 2. Grey bars is AO index, blue line AD index.
From this the significance of the post 2007 shift can be seen. Not having the mathematical ability to calculate EOFs, I've not been able to produce such a series. However I've noted that the NSIDC have said that since 2007 the AD has been a regular feature of summers post 2007, and have said that I suspect the pattern I found in Summer Daze was indeed the AD, ref.
But why see the AD in the new summer pressure pattern? This is simply a matter of the interplay between high pressure over Greenland and the CAA, and low pressure over the Siberian sector. Because high pressures rotate air masses in a clockwise manner, and low pressures in an anti-clockwise manner the action between the two pressure systems is like two wheels on either side of a plank of wood - the upshot being that they produce air motion across the Arctic basin, rather than around it as with the Arctic Oscillation. The reason this has a detrimental impact on ice is two-fold: First the motion drags warmer sub Arctic air over the basin, second the motion of the air drags ice with it, from the Pacific Sector to the Atlantic Sector.

In the above adapted graphic of this year's June to August I've annotated the general motion from low and high pressures (purples/blues and greens/yellows respectively). The most intense purple around which I've annotated low pressure flow for convenience is due to the early August storm.
The Atlantic sector receives a large amount of warmer water from the Atlantic, this melts ice. Indeed the reason the ice edge doesn't proceed much further into the Arctic than the chain of islands from Svalbard to Zemlya Franzsa Iosifa (map) is that poleward of these islands is an abyssal deep. The Atlantic water is saltier and denser than Arctic water, so when it hits the edge of the abyss it drops out of contact with the ice edge. This means that ice pushed beyond this demarcation is destined to melt out in the summer. Furthermore ice transferred to the Atlantic sector is likely to be entrained in the transpolar drift, which pushes ice out into the Fram Strait between Iceland and Greenland, where it melts at lower latitudes.
So the pattern I described in Summer Daze is really the Arctic Dipole. I do wonder whether it's correct to talk about the AD, because the one process may not be forming all incidents of it, e.g. going back into the 20th Century. But due to the consistent pattern identified in Summer Daze and discussed in Overland et al, I think it's safe to say that since 2007 there has been one over-riding process driving the formation of the pattern.
So what is causing this pattern? As this post is long enough already I'll go over that in the next post.
[1] Hanna et al, 2012, "The influence of North Atlantic atmospheric and oceanic forcing effects on 1900–2010 Greenland summer climate and ice melt/runoff."
Abstract.
[2] Overland et al, 2012, "The Recent Shift in Early Summer Arctic Atmospheric Circulation."
GRL, in press.
9 comments:
Hi Chris Reynolds. Thanks for this writeup. I am following this with growing interest. (after all I am living just a short way down the globe in central Europe, so this is our future weather youre talking about here).
I´d like to give a few comments/questions - out of a beginners perspective.
The picture you show. Is it of SLP anomaly, or of actual SLP (quantity)? Asking because you treat it like a real SLP map in drawing the wind flows. But in the discussions about the Summer Daze you made the point that this would not be Wayne Davidson´s "shifted Cold Pole" as it were just a SLP anomaly - whereas you used the underlying actual SLP plot to show that it was actually a modified "standing wave" a la Francis. This gets me confused.
Similarly, I also cant do the maths for EOF´s but I think I remember the concept form my earlier science days. Is this plot you give there then a map of just this EOF? If it were, would it then not be just a map of one element of many that collectively build up the total pressure field, also meaning you could not simply draw wind flow lines based on just this EOF? Would the "wind flow lines" based on this not just be an element (amongst others) all of which would have to be assembled to get the real wind flow? (I hope this was not too confused).
Next point. The AO as you describe it (thank you) would be symmetric about the arctic. But the AD as you describe it, if it creates a wind flow "across" the arctic, would not be so symmetric. There are many ways that air can flow across the arctic. You draw it from Canada to Siberia. My understanding is that the Transpolar Drift in actuality is caused by a prevailing wind direction - also across the Arctic - but from Siberia towards the Fram Strait. Would this also qualify as AD? Or, in other words: if you have that high over Greenland as you draw it, you can draw the clockwise rotation. Agreed. But for the transarctic air movement would it not matter most where (in longitude) the actual Low P centers are situated around this High?
Is that not where the paper I found yesterday might link into this? They seemed to say that a deep low anomaly developed post-2007 over what they had found as newly extensively deiced marginal sea. (Laptev in that case). If you put your main low there, then the direction of your main wind arrow would rotate quite a bit, not? Similarly - you could have drawn a thick arrow between the UK/Atlantic low of your figure, and the Greenland "high" - to pull air from scandinavia towards the west over the North Atlantic. So, what controls which way the "AD configuration" would be oriented longitudinally? Would this not matter very much?
questions asked in simple curiosity. I hope you dont mind. This gets ever more interesting.
Marsanges,
The pressure anomaly is the difference from the mean pressure. However it will still impact wind flows, so the difference from mean pressure will still impact the difference from mean winds. The fact that the August storm show up in the plot shows that the anomalies do show us real world pressure changes with real impacts. You can imagine the purple/blue area as a smearing of contributions from individual low pressure systems.
I'm not sure I disagree so much with the idea of a shift in the centre of action. Although I'm not persuaded by the reasoning - that the reduction of ice has shifted things to the nearest ice - Greenland. Having thought about it, the winds as a result of those pressure changes will represent a new circulation. And on the average they're implying circulation around Greenland, not the ice pack. I still need to think more about this. But I think my problems with this will be more clear when I post the next post.
The transpolar drift is driven by the Beaufort Gyre, which is due to typically high pressure over much of the Arctic.
http://nsidc.org/cryosphere/seaice/processes/circulation.html
In the Atlantic sector this results in the Transpolar Drift. But the net movement of air that creates the drift is zonal (around) not meridional (across).
Yes the EOFs extract information about the patterns involved, but the real world is the sum of those patterns. That' why I don't like calling 'Arctic Dipole' unless the AD pattern is very obvious. It really takes maths to talk with certainty.
You're quite right that in terms of the actual direction of net flow along an AD where exactly the pressure centres are located is critical and this has a large impact on what effect it has on the ice. But broadly speaking the -ve AD is from Pacific to Atlantic and the positive from Atlantic to Pacific.
The Bluthgen paper you're referring to has been addressed in the next post - which will be on line either later today, or tomorrow morning.
Sorry if this blog can be confused at times - it merely reflects the fact that I don't have all the answers so sometimes I get confused.
Marsanges,
Just another idea about the issue of mean pressure and pressure anomalies. Might make things more clear.
The mean pressure reduces as you go further north across our latitudes of the Atlantic. This means that the net air movement is from west to east. But within this there can be high and low pressure systems (anomalies from the mean) that mean the air movement isn't always from west to east.
Hi Chris ..
( I hope you dont mind if I have troubles with my identity, somehow I cant figure out how to control whethere I´ll appear as marsanges or Enno or Anonymous)
just an update for your reading list, Journal of Climate new issue (October). I think its in your ballpark. Davini et al. (Italians). Abstract:
--------------------
In this paper, Northern Hemisphere winter blocking is analyzed through the introduction of a set of new bidimensional diagnostics based on geopotential height that provide information about the occurrence, the duration, the intensity, and the wave breaking associated with the blocking. This analysis is performed with different reanalysis datasets in order to evaluate the sensitivity of the index and the diagnostics adopted. In this way, the authors are able to define a new category of blocking placed at low latitudes that is similar to midlatitude blocking in terms of the introduced diagnostics but is unable to divert or block the flow. Furthermore, over the Euro-Atlantic sector it is shown that it is possible to phenomenologically distinguish between high-latitude blocking occurring over Greenland, north of the jet stream and dominated by cyclonic wave breaking, and the traditional midlatitude blocking localized over Europe and driven by anticyclonic wave breaking. These latter events are uniformly present in a band ranging from the Azores up to Scandinavia. Interestingly, a similar distinction cannot be pointed out over the Pacific basin where the blocking activity is dominated by high-latitude blocking occurring over eastern Siberia. Finally, considering the large impact that blocking may have on the Northern Hemisphere, an analysis of the variability and the trend is carried out. This shows a significant increase of Atlantic low-latitude blocking frequency and an eastward displacement of the strongest blocking events over both the Atlantic and Pacific Oceans.
Thanks Marsanges,
The abstract is here, paywalled paper though.
It really does look like the topography of the Atlantic makes it a very interesting place. I'll get round to that paper in due course.
What immediately interested me was the title of this paper, on that page:
P. Davini, C. Cagnazzo, R. Neale, J. Tribbia. (2012) Coupling between Greenland blocking and the North Atlantic Oscillation pattern. Geophysical Research Letters 39:14,
Online publication date: 1-Jan-2012
Although it seems this isn't related to the Summer Greenland ridge and associated Arctic Dipole because they talk about a decreasing frequency of Greenland Blocking. My understanding of the summer situation is that Greenland high is a blocking high.
There's a spanner in the works for my plan of reading. I've been pushed into a promotion and am now busy learning a load of stuff for some new qualifications. I'll have to see how long I have for blogging and the needed background reading.
Hi Chris,
Thanks very much for pointing me in this direction from Neven's blog.
I just thought I'd let you know I've recently been involved in a heated debate on the merits or otherwise of wind turbines over on ThisIsDevon. Even David MacKay has passed comment!
As a side effect of all that I've also posted a link to your estimable blog in a comment to this article:
http://www.thisisdevon.co.uk/Recent-wet-summers-caused-warming-North-Atlantic/story-17050818-detail/story.html
I hope that's OK with you!
Jim
That's fine Jim,
I'm not convinced by the research blaming the wet summers since 2007 on a cycle. The top link in the main post leads to my earlier post which I view as a pretty conclusive (albeit rough and ready) linking of cool wet summers after 2007 to events in the Arctic. It's a pattern that I show to be unique since the 1950s. Overland et al have found the pattern to be similarly unusual.
There may be a pattern of increased rainfall from warmer Atlantic water, but that doesn't explain the behaviour since 2007 in the way that the Arctic Dipole does.
However bear in mind that the pattern involved is from June to August. So flooding in October is unrelated to the Arctic Dipole. Or perhaps I should say - my reasoning that shows a summer role, does not show an autumn role.
I'm not convinced either, particularly by the bit about "The pattern is likely to revert to drier summers and may do so suddenly".
The pattern here is as follows:
June - 191 mm
July - 78 mm
August - 122 mm
and still it continues. Personally I can't wait for Rowan Sutton's predicted drier summers, and drier autumns for that matter!
I don't expect the pattern to switch to drier summers. However it's hard to say exactly what is driving the Early Summer Arctic Dipole pattern. Overland 2012 suggests snow cover changes from June onwards. I think there's a point there, but can't shake from my head a possible role for reduced sea ice due to the coincidence of 2007's record crash and the following step lows of sea ice, and the ESAD becoming entrenched from 2007 onwards. My hunch is that it will continue, ad if it does that means wetter summers - at least until we see what effect earlier sea ice free conditions have once we get to that stage.
Post a Comment