First off. A couple of weeks ago I posted "How Low Can it Go". In a nutshell I pointed out that 2007 and 2011, the previous two records, ground to a near halt in the last week of August, as the sun set on the central polar region. So I suggested that the same would happen this year.
It hasn't.
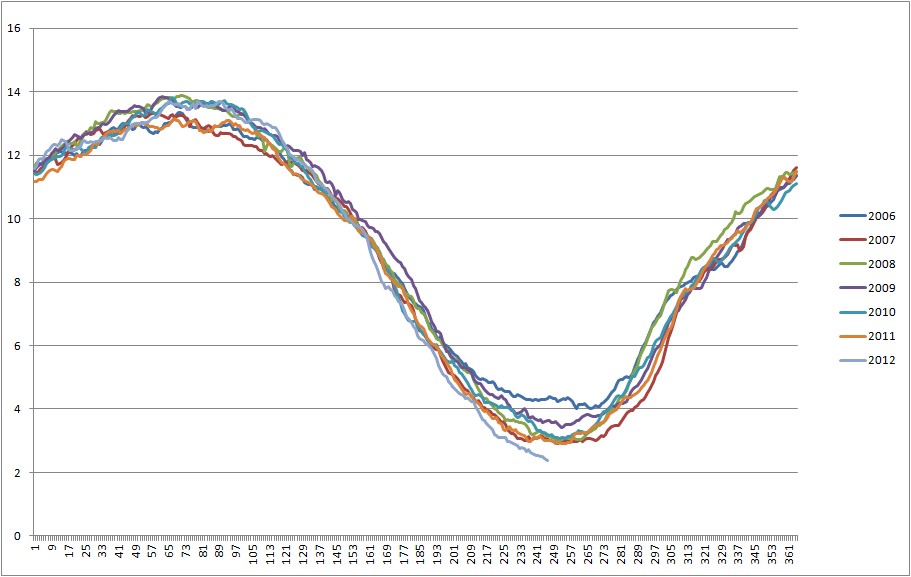
The measure I use is Cryosphere Today's area metric, dataset here. It's still dropping precipitously now at 3.722M km^2, 0.533M km^2 below the previous record set last year. That's a staggering -18% from the last record. Not as large as the loss between 2006 and 2007, which was -27%, but still massive.
It seems I was wrong on my minor prediction, but why? I can't see anything in the weather that screams out as the reason for the continuing losses, which brings to mind a question that's been bothering me all year. Just what state is the ice in?
The main reason for posting though is that in considering a reply to Jim Williams at Neven's sea ice blog (thread on my recent posts here), I had an idea so simple I can't believe it didn't occur to me before.
The issue is why would the seasonal cycle change after the volume loss of 2010 such that there is volume loss in the calculated thickness series over the summer, when previously there wasn't. I need to think about it some more, but here's my initial stab at an answer.
Thickness of a given region, be it the whole ice pack, or a grid box, is the average of all the thickness categories of ice in that region. So what happens when the ratios of thick ice and thin ice change?
I've spreadsheeted a simple toy model. I assign different ratios of ice totalling 100%, so for example first year ice (FYI) may be 60%, which means multi-year ice makes up the remaining 40%. The graph below gives the percentage contribution of multi-year ice (MYI). FYI is assumed to melt at a higher rate than MYI. In the model FYI loses 0.15 units per time period, MYI loses only 0.05 units per time period. The ratio of these different loss rates is exaggerated to see what happens, and the loss rates don't change as the 'ice' moves from mainly MYI to mainly FYI, it's just a toy model to show an idea.
I then calculate the average thickness for the total amount of ice, taking into account the relative proportions of the MYI and FYI. Assuming a constant linear rate of loss for each type of ice, what happens when I vary the proportion of MYI and FYI?
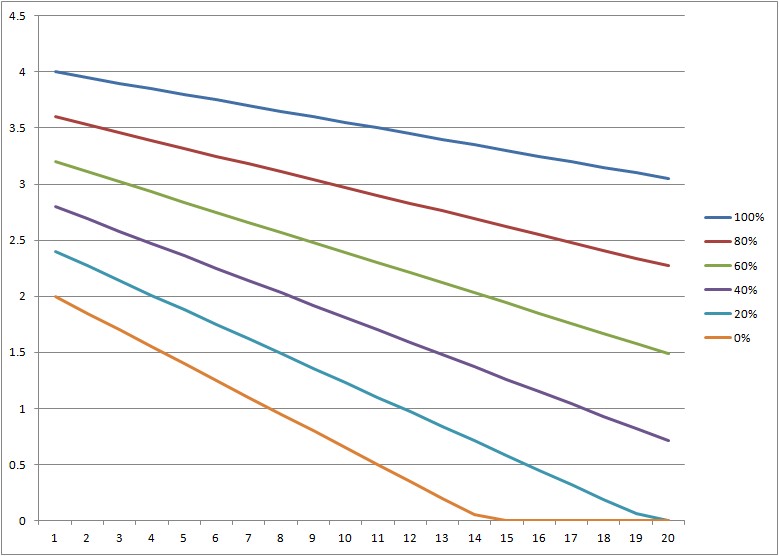
Time on horizontal axis, thickness on vertical.
Because the ice categories are defined as being different thicknesses to start with, MYI is 4m thick, FYI 2m thick, the starting average thicknesses vary, from 4m thick when 100% is MYI, to 2m thick when 100% is FYI. So the average thickness traces go down as the ice moves from 100% MYI to 0% MYI.
But what's interesting is that the slope of the lines gets greater. Which is what we've seen in calculated thickness during the summer period after 2010. Indeed, before then there's a tendency for this to happen for more recent decadal averages.
So is the answer to the summer thinning conundrum in post 2010 calculated thickness simply that the ratio of thicker MYI has decreased relative to FYI? Is it just that the MYI that had previously biased calculated thickness upward throughout the summer, as the FYI proportion declined relative to the thicker MYI off the Canadian Arctic Archipelgo, has been so denuded by the loss event of 2010 that's no longer having this biasing effect?
Notice too: You keep the initial thickness the same, i.e. no thinning in winter, and simply remove increasing amounts of MYI, and you get open water... This is only a toy model, and shouldn't be used for anything but examining an idea, but to me that's an interesting outcome.
5 comments:
Great and thought-provoking series of posts, Chris. One little correction:
"[CT area is] still dropping precipitously now at 3.722M km^2, 0.533M km^2 below the previous record set last year. That's a staggering -18% from the last record. Not as large as the loss between 2006 and 2007, which was -27%, but still massive."
I believe you're actually quoting IJIS extent #'s but CT % drops:
Today: 2.372m km^2
2007/2011 shared record: 2.92m, so -19%
2006-2007: 4.02m to 2.92m, so -27%
Chris,
I am an electrical engineer not a climate scientist but I did spend a year in Greenland and can tell you it does not snow in the winter - it is to cold. I believe this may be providing additional positive feedback for melting.
When it does snow (spring and fall) especially in the fall, the ice is not there as it now freezes later, so the snow falls in open water and thus isn't there to protect the ice when ice melt starts in the spring.
I don't know the total forcing of this but it seems to me that it could be an unfortunate further amplification of melting
Charles Bayless
Ceb1618@aol.com
Hi Dan,
Thanks for the comment, but I'm sure of my figures. They're not IJIS, they're Cryosphere Today area (CT area). You can check them here:
http://arctic.atmos.uiuc.edu/cryosphere/timeseries.anom.1979-2008
2006 4.0169191 min
2007 2.9194391 min
% drop -27.321%
2011 2.9047396 min
2012 2.3722196 day 246
% drop -18.334%
Figure M km^2.
As is usual for this time of year, the latest figures, day 247, show a slight uptick; 2.3765626.
I've given up trying to figure out how low it will go now.
Hi Charles,
Thanks for the comment, that early snow doesn't cover sea ice could also be seen a a negative feedback. Ice grows mainly due to accretion on the base due to heat flux from the relatively warmer ocean to the frigid conditions above the ice. Snow acts as an insulator reducing this heat flux, thus reducing accretion.
I'm constantly befuddled by the complex interplay of feedbacks on Arctic sea-ice. But the basic message is now quite clear, the net feedback is strongly positive.
I don't envy you Greenland. I work in a calibration lab (electronics too), temperature and humidity controlled 24 hours a day, 365 days a year.
Chris - how is it possible we both work in calibration labs and it hasn't come up before now?
LOL
I've been working on nothing but measurement uncertainty budgets for months now; I actually get to go out and be a technician again for a whole week at the end of September - a little jaunt over to IBM in Rochester, MN to do some work.
As far as the sea ice - I'm with you on the attitude that if we're going to have a RILE, then at least I get to watch the show.
Hi Kevin,
Quite a coincidence!
Trust two engineers to get the significance of the change in PIOMAS seasonal cycle!
If it hadn't have been for the MN, I'd have assumed you worked here in the UK. I've been working on telecomms for most of my career and took a pay cut to calibration - because a 9 to 5 job suited this hobby better.
When you sit back and think about it, it's quite a privilege to be able to sit in the comfort of your home and use the staggeringly advanced technology at our disposal to watch it all unfold.
As you work in calibration - I assume that like me you're in awe at ICESat and Cryosat 2's achievements. Measruing the thickness of somethings a few meters thick from miles up in space.
Staggering.
I'm reminded of Clarke's third law:
"Any sufficiently advanced technology is indistinguishable from magic."
Post a Comment