In this post I present graphs of the daily anomaly series from 1980 to 2012. This is a place holder for reference from future posts.
Click on any of the images to bring up full screen, with a selection menu at the bottom of the screen (this applies to all posts on this blog).
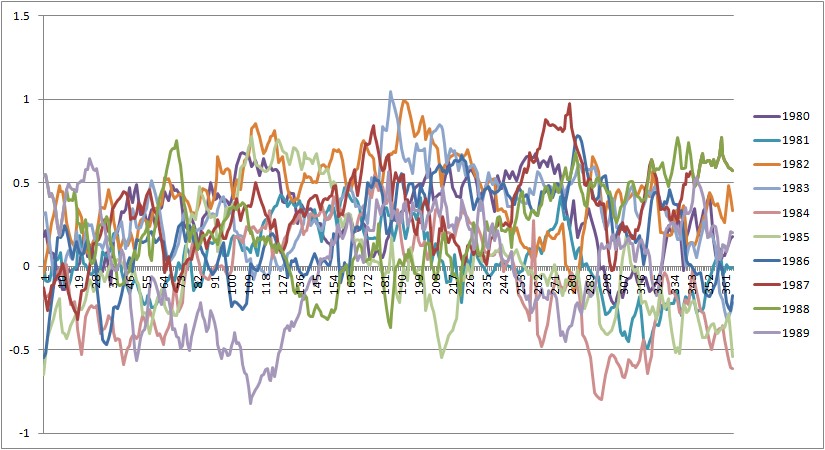
Cryosphere Today sea ice area anomalies 1980 to 1989.
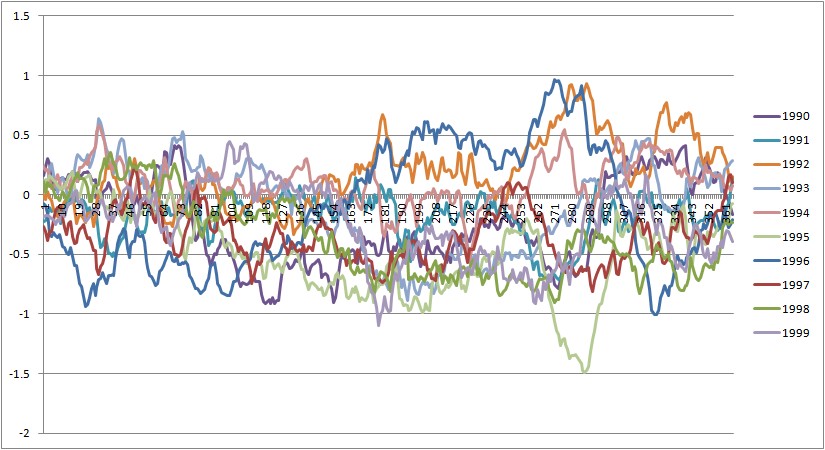
Cryosphere Today sea ice area anomalies 1990 to 1999.
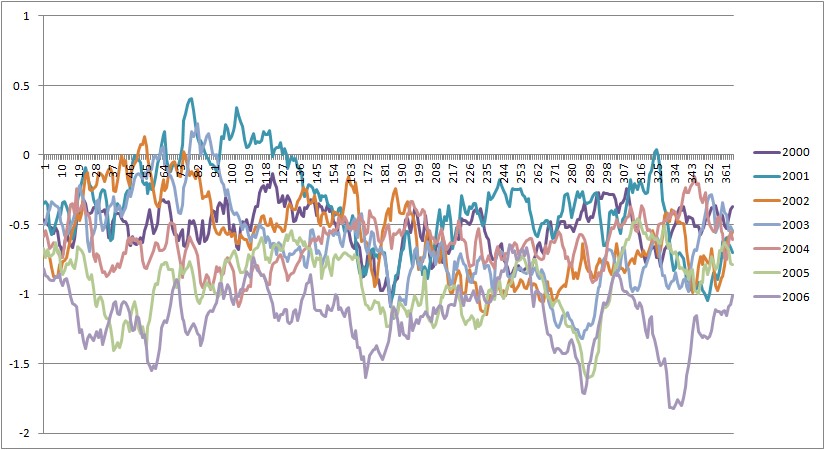
Cryosphere Today sea ice area anomalies 2000 to 2006.
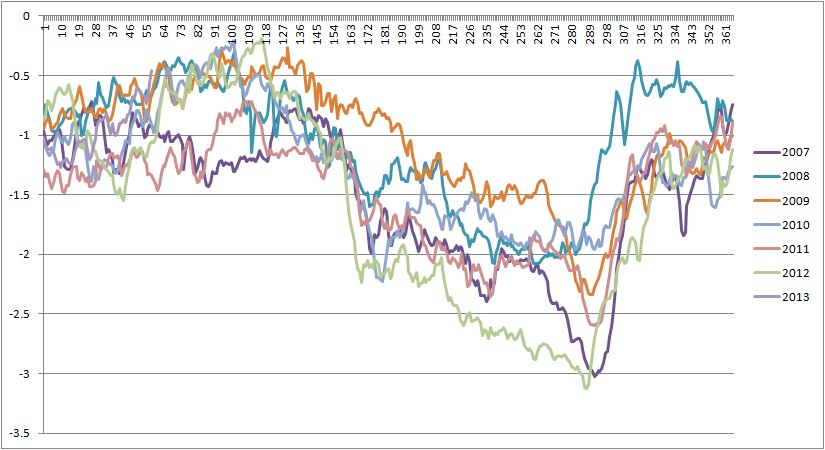
Cryosphere Today sea ice area anomalies 2007 to 2012.
2 comments:
hello, the shape of the 2007-12 anomaly curve looks somewhat the same as the shape of yearly general progress of melt/gain. this would mean that the yearly pattern of loss/gain has intensified, switched gear, gained in amplitude, or what ever metaphor you want to use.
Yes, the summer melt and autumn freeze have both intensified since 2007, with a further intensification since 2010.
Post a Comment