I've recently read Keen et al, 2013, "A Case Study of a modelled episode of low Arctic sea ice", before commenting on it I need to ruminate further. But figure 2 intrigued me. It's a plot showing the area weighted percentage of ice that melts out completely changes as a function of April sea ice thickness.
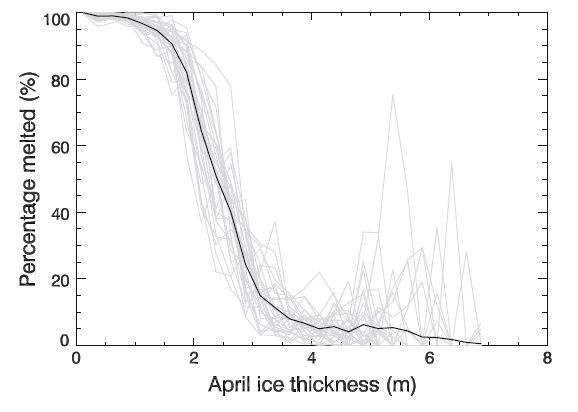
So I thought I'd reproduce that using the PIOMAS gridded data.

Here I've calculated, per grid box, the area weighted percentage of ice melting out to open water as a function of the April thickness of the grid box. 5cm 'boxes' of April thickness were used, with under 5cm grid box thickness being left out of the calculation as open water. I'll have more to say about this plot and its implications in a future post, but for now...
With some minor re-jigging of the code I was able to calculate the average thickness loss from April to September as a function of April thickness loss.
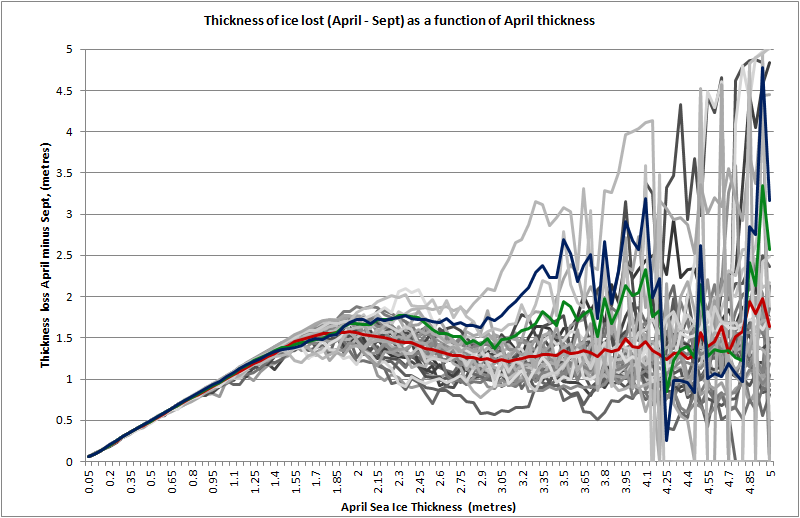
In both of the above plots the grey plots are for all years 1978 to 2012, lighter greys for more recent years, darker for earlier. Red is the average of that full period, green is the post 2007 average, blue is the average for 2010 to 2012.
It's this latter plot that got me thinking; could I use this distribution to make a projection of 2013 sea ice volume?
The PIOMAS team were kind enough to release thickness data up to March in April, so having March data I reworked the thickness loss data for March to September. Not ideal as there's more thickening after March, but it will have to do. I then used the post 2007 years as 'scenarios', hence my saying this is a projection, not a prediction.
So I wrote some code to load the average thinning 'scenarios' of the thinning as a function of March grid box thickness back into Excel VBA, and applied these thinning profiles to each PIOMAS grid box with a thickness over 5cm thick, applying the relevant average thinning dependent on the March thickness. This allowed me to calculate total volumes in September.
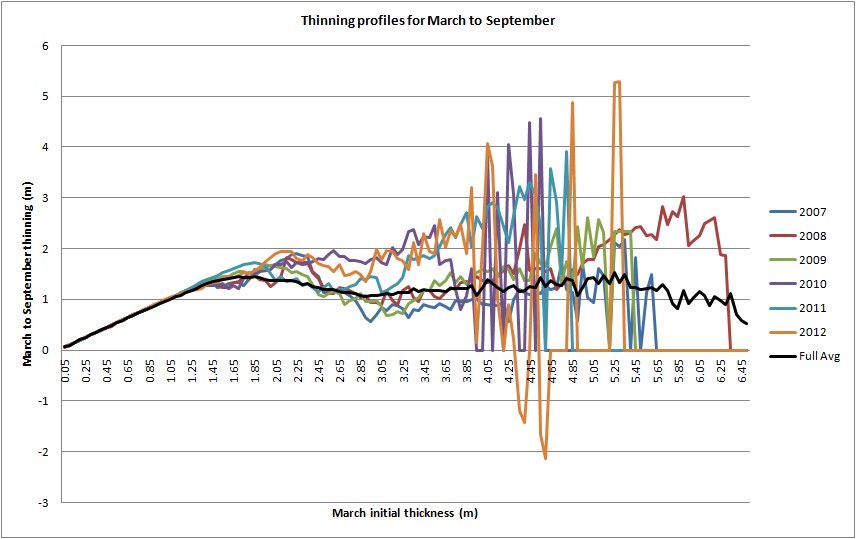
Above is a plot of the thinning profiles up to 6.5m, with the full average of 1978 to 2012.
The resultant table of volumes is shown below. The columns are the March thickness profiles for the respective years, the rows are the thinning profiles for each stated year. In other words following row 2010 along I apply the March to September thinning profile to the March grid box thicknesses for 2007, 2008, 2009 etc. And going down the columns, for example 2008, I take the initial thicknesses for all grid boxes with ice in March and apply the thinning profiles of 2007, 2008, 2009 etc. Hindcasts are in black, these are the results for running the procedure for past years, the bold numbers are where I run the thinning profile for the 'correct' year. Note how the figures are close to the Actual minima but not exact; The actual figures quoted are monthly averages from the PIOMAS 'main series', and there is a small difference between grid box areas I'm using and the areas used by the PIOMAS team, which is apparent as a difference in volume. Using the volumes I have calculated (not shown) still shows a difference, probably because I am using the average seasonal thinning to calculate the table.
However the closeness of the 'same year' runs and actual volume is encouraging, if not unexpected.

Following down the columns is easiest done in the percentage error table. Here it is apparent that applying the thinning profiles of the post 2007 years to each March initial thickness produces a broadly declining error, starting off overshooting (or slightly under-projecting) the actual PIOMAS minimum volume, and ending up under-projecting (or slightly over-projecting) the actual PIOMAS minimum volume. The reason for this is somewhat apparent in the plot of thinning profiles up to 6.5m. The thinning profiles have become more aggressive as time proceeds, with the post 2010 years showing significantly more thinning, note the step drop in all columns between 2009 and 2010.
Going across the rows (actual values in upper table), where I apply a constant thinning profile to different March initial conditions, it is apparent that 2011 and 2012 show a step drop from earlier values. In March 2010 there was still a large proportion of thick multi-year ice (MYI), which was substantially thinned by 2011 and 2012.
If one ignores 2012, to get an idea of how this projection method would have worked last year, only the melt profile of 2010 would have given a new record, other years indicating a gain on 2011.
However it is notable that the 2012 thinning profile when applied to all March thicknesses produces the lowest volumes for each March thickness. The post 2010 thinning profiles applied to 2013's March thickness all give minimum volumes that are below 2011's volume.
So this method seems to be giving an equivocal result. One might settle on the numbers alone and say that this year won't be a new volume record. However progressive years of thinning profiles seem to be more aggressive as time goes on, if this behaviour happens then (as with the hindcast for 2012), one might expect all of the projections for 2013 to be a bit high. Then again, for reasons peculiar to 2012, the depth of that record low, and severity of the thinning profile may be a 'one off', much in the same way that 2007 and 2010 were exceptional years. However if one accepts that interpretation then three 'black swans' in 6 years is striking.
Given the unique behaviour of the post 2010 years the best way to approach this is to take the projections using only the post 2010 years. If correct that would mean this year's volume record would beat 2011 soundly, but only come close to matching 2012, not making a new record.
But I still think this year will see a record melt. 2012 had an arm of MYI which lead to persistent dispersed ice in Chukchi/Eastern Siberia. It took the August storm to remove that impediment. This year there is no MYI to impede the Siberian melt. The pack this year is arguably more first year ice than it has been in the history of sea ice watching.
5 comments:
Keep in mind, the thinning in 2012 was in large areas aborted when the thickness got down to zero. Therefore, you can't reasonably equate actual thinning with 'thinning potential', as areas that were open water in September had a thinning potential >= the actual thinning but otherwise the 'excess' is unobservable.
It's not clear to me exactly how one could attempt to account for this, although I suppose a crude first-order-correction could be had by simply thinning each pixel only until the point in the season at which it became open water in 2012, then continuing to thin based on another year (e.g. 2011) until mid-September or whenever thickness reaches zero, whichever comes first.
Although a more-or-less WAG, I suspect this would produce a projection of less ice in Sept. 2013 than in Sept. 2012 on all three measures (extent, area, volume).
Nightvid,
Are you referring to the large swathe of persistent low concentration ice that formed in Chukchi/East Siberian from July, and was decimated by the Arctic Cyclone of early August? This is one of the reasons why I think the August melt profile of 2012 wouldn't beat last year when applied to this year's March thickness profile. I'll have more to say about this in an upcoming post. But suffice to say for now; I think this retarded melt was due to a tongue of MYI that had pushed into the region.
The last three posts (including this one) are part of a series leading to a conclusion.
I agree about less ice this year's minimum in all measures, it's what I am expecting.
Chris,
I'm actually referring to the areas in Beaufort/Chukchi/E siberian/Laptev that had already opened before the big storm hit because of very thin ice in March/April. Since the ice cannot thin more than its starting thickness, those areas had 2012 thinning suppressed. Subtracting the suppressed 2012 thinning from the March/April 2013 thickness will underestimate open water formation.
I get you now,
There was also the thinner ice in Barents/Kara.
Post a Comment