The raw data is available here, and an Excel spreadsheet containing the data, adjusted to a common 365 day year, is available here, use File>Download to access the file.
I have calculated the day numbers (year as 1 to 365) at which the area crosses successive thresholds; 6, 7, 8, 9... etc million(M) km^2. These have been tabulated in columns for each year of the available data, 1979 to 2012. Also for each year the daily September minimum CT Area has been included in considerations. For the dates of threshold crossing a date anomaly has been calculated as the difference between the average date for each threshold crossing (1980 to 1999 average) and the actual date of threshold crossing for each year. For numeric correlations all data has been de-trended by taking the difference between each year, giving data for 1980 to 2012.
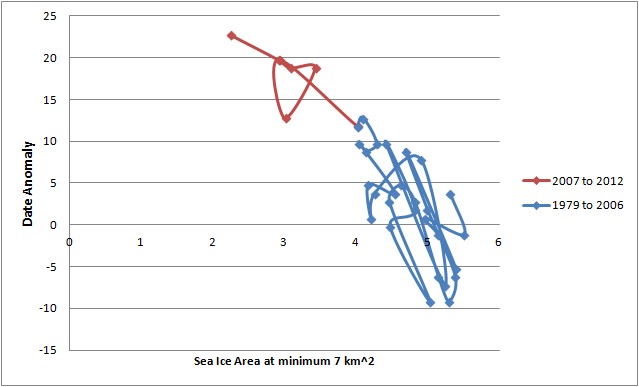
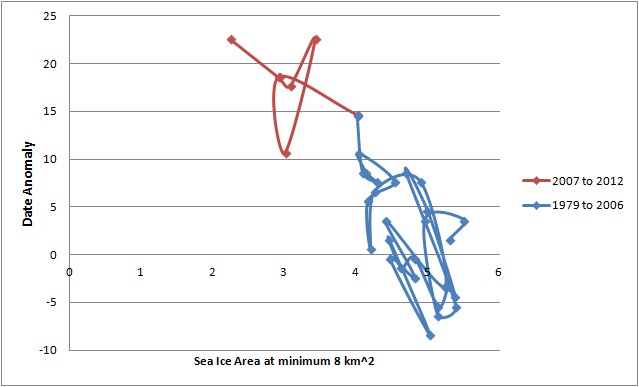
Plotting the relationship of date of threshold anomaly as a function of sea ice area at minimum gives the following graphs.
6M km^2 threshold.

7M km^2 threshold.
8M km^2 threshold.
9M km^2 threshold.

10M km^2 threshold.

11M km^2 threshold.
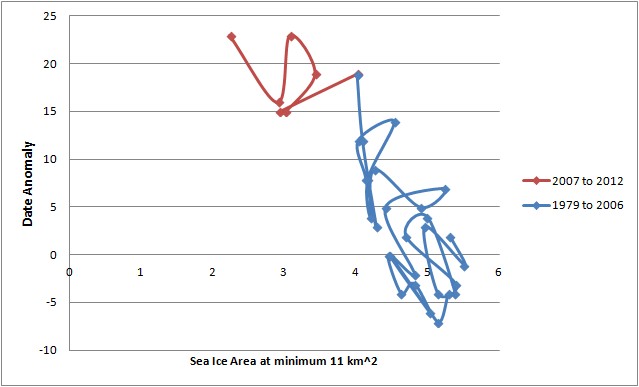
All plots show that as the sea ice area at minimum goes down, so the date at which the various thresholds are attained gets later, as will be shown this is mainly due to an increasing delay after the 1990s. That noted, the plots for 6 and 7M km^2 are strongly suggestive of a rapid decline of magnitude of impact of sea ice recession at minimum on the autumn refreeze. If they continues to zero area they suggest that the delay in attaining those thresholds will not be much greater than 30 days. However these graphs tell us little about what would happen in a seasonally sea ice free state with increasing periods ice free during the summer.
Despite the above shown delays to refreeze onset winter maximum date has no significant trend and no relationship with preceding minimum area.
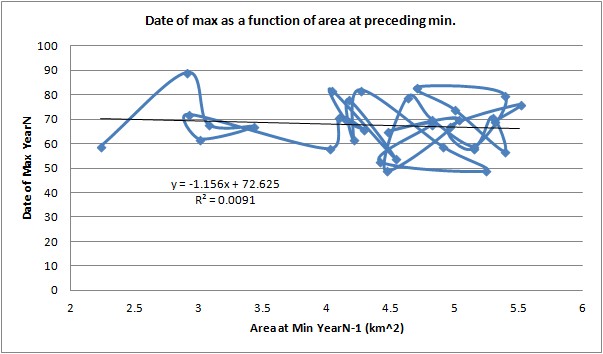
Furthermore, the date of maximum and minimum show no change with time and no relationship with area at maximum or minimum respectively, this can be appreciated from the lack of trend in either, despite the strong trend in area.

Over at the forum Ice Cool Kim has used Gaussian filtering to extract a suggested change to the length of melt/freeze cycles. I have reproduced their results and the claimed shortening of the melt season seems to be largely due to later peak dates in the filtered data. Whether this means anything physical or is an artifact of the filtering method picking out other changes in the cycle (low frequency elements*) is, as far as I am concerned, not clear. I suspect that there is a change around the winter maximum of the sort I will outline below after the summer minimum, but three years is insufficient to identify it robustly.
At present I am working on the assumption that the variation in maximum date in the raw CT Area data is a case of random variation around a fixed point. It still seems to me that both date of maximum and minimum can be considered unchanging and fixed by the unchanging forcing of insolation's seasonal changes, with 'weather' (both ice and atmospheric) causing random variation. So until further information changes my opinion I will continue to view the dates of maximum and minimum as fixed 'tie-points' around which other changes must organise themselves.
It can be seen that up to 8M km^2 there is a tight form to the relationship, the form of which deteriorates as the ice edge expands. However from the 9M km^2 threshold onwards while there is still a form, the relationship is not as neat as in the earliest plots (6 and 7M km^2). This is borne out by correlations using de-trended data. The statistically significant correlations are emboldened.
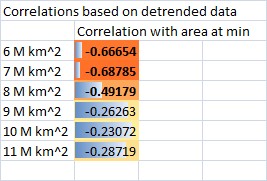
Clearly between the 8M and 9M km^2 thresholds the correlation between date of threshold and area at minimum falls off. This is happening because between 8M and 9M km^2 the sea ice edge expands to fill virtually the whole of the Arctic basin. Beyond this point ice growth occurs in seas largely isolated from the changes in the Arctic sea ice, where recession of the ice edge is largely governed by global warming, and regional response to that warming (ocean & atmosphere). For the early part of the refreeze the reduction in area is the dominant factor.
There is an asymmetry in the annual cycle. While the effect of the ice growth tails off after 8M km^2 when the ice edge leaves the Arctic Ocean basin in early November, the reverse happens in early June at an area of around 10M km^2, this being the cause of the June CT Area crash in 2007, 2010, 2011 and 2012 (as seem in the previous post after about day 160). This asymmetry is mainly caused by ice being present in Hudson Bay and Baffin/Newfoundland in early June, while this ice has not yet grown in early November. For example, 1985, 2000, or 2012.
The following table provides information on the average time between thresholds (in days) and average date of thresholds. The pre and post 2007 periods are each 6 years before and after that date, with 'delta' being the difference between values on the left side. For the average time between thresholds, values for 6M are the difference between 5M and 6M, and subsequent values are the difference between stated threshold and it's preceding threshold, e.g. 7M is the 7M km^2 threshold date minus the 6M threshold date.
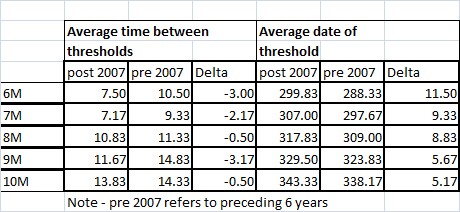
It can be seen that the thresholds are occurring later (+ve delta), implying a delay to the re-freeze which is probably because more open water gains more heat which takes more time to vent to the atmosphere before melting can commence. However on top of that the time taken to get from one threshold to another is initially decreasing (-ve delta), implying that once the refreeze starts it proceeds more rapidly. There is a further reduction in time between the 8M and the 9M threshold, I haven't figured out why this is occurring.
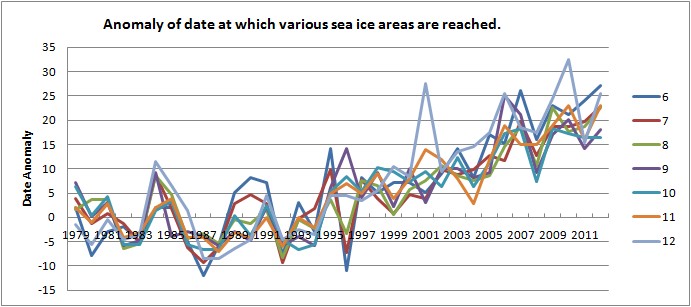
As the above plot shows, since the 1990s there has been a consistent delaying to the onset and progression of the re-freeze, however as the date of minimum does not show a similar trend, this suggests a flattening after the date of minimum. The most likely explanation for this flattening is that as more open water is occurring earlier in the melt season insolation and ice/ocean albedo feedback is putting more energy into the ocean, this energy needs more time to be lost before the refreeze can proceed fully.
***
So what is the cause of the autumn correlation between ice area and the increasingly rapid growth of sea ice in response to decreasing sea ice area at the end of the melt season?
Sea ice grows as a result of heat being drawn away from the ocean surface until the ocean is cold enough to form. The initial ice formed is a slush of ice crystals in sea water, called frazil ice. As more heat is drawn into the atmosphere the frazil ice gets thicker until a sheet of young ice called nilas ice develops.
Key here is the temperature difference between the ocean and atmosphere, and within the Arctic this temperature difference is caused by the setting of the sun in autumn. Because of the tilt of the planet the Arctic then enters a long period of cold which intensifies, drawing more heat from the ocean and thickening the nilas ice. Over the winter this process forms new ice which is typically able to thicken to around 2m thick given the cold atmospheric temperatures and the length of the freeze season.
As the ice thickens it insulates the ocean from the atmosphere better, so most of the ice volume growth happens in the autumn and early winter. However to appear as ice for the satellites monitoring ice area the ice need only form to a few tens of centimetres thick. So very rapid gains in area are possible as new ice forms and spreads to cover the whole Arctic region within a few weeks.
However before this can happen the ocean needs to lose heat, this is occurring to an increasing degree due to increasing open water during the melt season. I've previously blogged on the cause of Arctic Amplification, a large part of which is an autumn warming, link. This low level autumn warming of the atmosphere is due to the loss of heat which needs to occur before the ocean can freeze, although it continues later into the autumn due to anomalously thin ice replacing regions which in the past didn't melt out by the end of the melt season.
So in the autumn we are seeing the consequences of increasing melt season open water, delaying the onset of refreeze and warming the atmosphere. As I have pointed out earlier, the ice/ocean system is acting as a capacitor and is skewing the energy budget of the late summer / autumn arctic system. It seems reasonable that as in the future we see more open water in the melt season there will be an increasing delay to the onset of refreeze, while insolation will continue to set an unchanging date where the balance will tip from the summer to the winter regime.
The winter maximum ice edge is mainly set by thermodynamics in seas outside the Arctic Ocean, so the maximum area/extent will not be affected directly by conditions within the Arctic Ocean. Growth of sea ice area is a rapid process once the ocean has cooled. However the delay to re-freeze does have the potential to curtail ice thickening by reducing the time available for thickening. This should not be expected to be a massive effect, as most of the thickening occurs in the early months of refreeze, so moving these to later dates will truncate the time available for the slower thickening in the following year. However due to the importance of April thickness on the amount of melt in the following season, this can be considered a weak positive feedback on ice loss. The net autumn effect is that of a negative feedback, as more open water and thinner ice replaces thicker ice at the end of the season, fast growth of ice volume acts to counter the volume losses in the melt season. This being the 'thickness/growth feedback.
No comments:
Post a Comment