Hadden: The powers that be have been very busy lately, falling over each other to position themselves for the game of the millennium. Maybe I can help deal you back in.Ellie: I didn't realize that I was out.Hadden: Oh... maybe not out, but certainly being handed your hat.
Since posting my rather high prediction on CT Area I've been having doubts about it. A reason to to have confidence in it is the success last year, against the expectations of many including myself. However this year I think CT Area will be at the lower end of the prediction (3.0 to 3.3M km^2), if it is successful, and there is too much of a chance of 2014 being below 3.0 for me to have much confidence in it. The method trains the range to the 2007 to 2013 period, so it is likely overfitted and does not reflect the full range of feasible behaviours after the volume loss events of 2007 and 2010.
As I've discussed previously, since 18 June 2014 losses have been around 100k per day, the most recent NSIDC extent data shows a 250k loss.
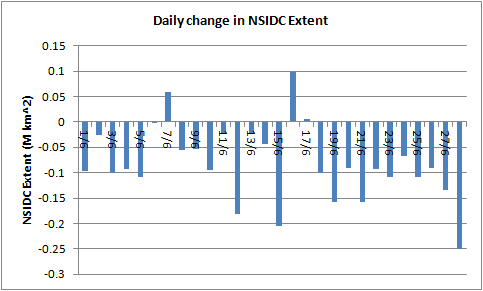
This might go without comment, 15 June saw a loss of 205k. But with GFS and ECMWF showing dominant high pressure (Wetterzentrale) for at least the next 8 days, and the clear role of the development of dominant high synoptic pattern from 18 June in the above start of losses, it may be significant. There is reason to expect the current weather to continue; it is very similar to the summer average in sea level pressure from 2007 to 2012. It looks to me like we're back in the new normal from a weather point of view after 2013 failing to show a similar atmospheric set up.
Considering the difference between 2014 and the years from 2007 to 2013, the following graphic is the difference between 2014 and each year for each date.
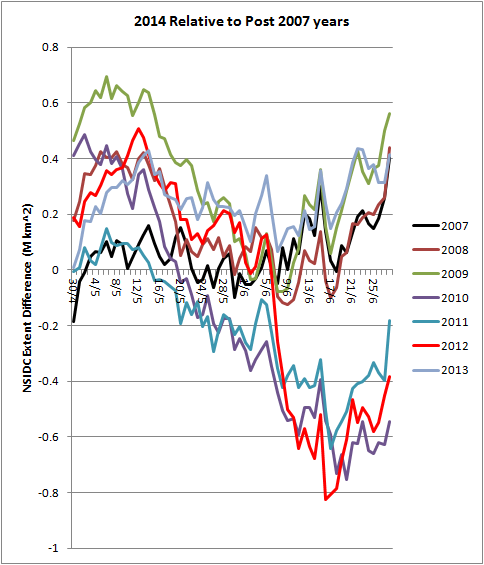
2007 shows that events later in the season can change the situation. However at present 2014 is putting more distance between the years with high extent at minimum (2008, 2009) and is closing the gap on 2011 and 2012.
2010 is a particular case; in that year an export of multi year ice from the central Arctic delayed the progression of the 2010 melt season causing extent loss to slow later in the season, ref. There is a possibility that this export, which can be seen in ASCAT (Day 80 - 2010 & 2014) could delay melt in the Pacific sector of the Arctic Ocean, my current thought on this matter is that the multi-year ice exported in 2014 may not prove as resilient to melt as the thicker ice exported in 2010. Thickness of the Central Arctic ice is thinner in April 2014 (2.45) than in April 2009 (2.62m). Furthermore, recently Beaufort has seen rapid early melt, Cryosphere Today.
So as I see it the 2014 sea ice season hasn't been handed its hat, it's rolled up its sleeves and is looking across the table at 2007, 2011 and 2012 with a serious stare. I doubt it can challenge 2012, but beating or matching 2007 and 2011 seem within the possible this year.
Neven has produced his Update 4, 2014. My June Status will be posted early this coming week, when the data is in for June.
No comments:
Post a Comment