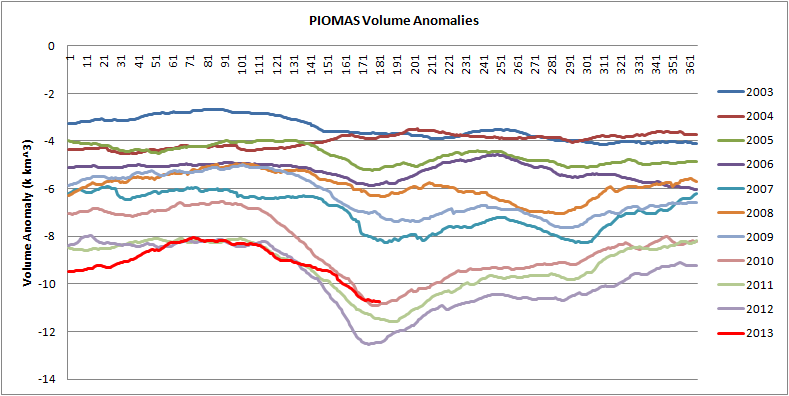
The volume by 30 June places 2013 above 2010 at the same time, however the volume remains below that of 2009 by a substantial margin, highlighting the scale of the 2010 volume loss.
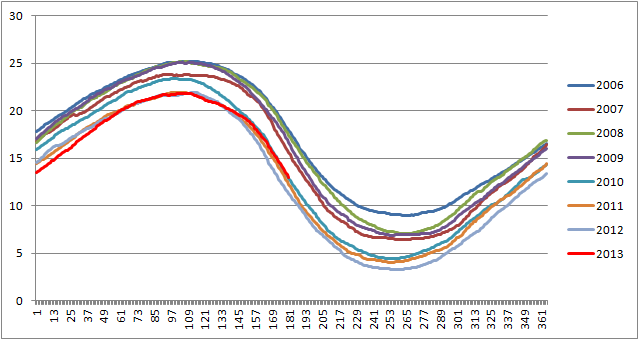
Anomalies from a long term baseline (1980 to 1999) show how the low pressure and cold outlined in the previous posts have prevented the spring melt that has been a feature of the other post 2010 years. What will almost certainly follow over the summer is either a levelling or rebounding of anomalies, talk of 2013 beating 2012 is now based on very shaky foundations.
However 2013 is still to be considered part of a set with recent years, and not a return to the form typical of pre-2007 years. From the anomalies above it can be appreciated that while the spring melt of 2013 was tempered, it was not absent, this was despite highly abnormal weather (in the context of the post 2007 years) that was not conducive to ice melt.
Another issue that is apparent from the anomalies is that from July onwards volume anomalies have either risen or remained broadly level until the annual volume minimum. If anomalies increase then the rate of loss is less than the baseline rate of loss, if anomalies are level then the rate of loss is equal to the baseline loss, where the baseline is the average seasonal cycle.
Looking at June volume loss since 1979 puts 2013 in context, it is clear that 2013 is one of a set with the post 2010 years.

This is even more apparent when considering the total loss from daily maximum to 30 June: 2013 is the greatest spring/early summer loss when one excludes 2010 to 2012.

The June 2013 losses can now be placed in context of the seasonal cycle of losses for all years back to 1979.

While there is an increasing trend of PIOMAS volume loss in June, and despite the slow start 2013 adds to that trend, July shows little trend, and August losses are on a downward trend. If we are to see a new record this year then we will need to see something remarkable throughout the rest of July and in August.
If /when PIOMAS gridded data is released I will blog on that separately.
3 comments:
Chris - I saw your request on OpenMind. You may wish to download Matrix 2.3 from http://digilander.libero.it/foxes/SoftwareDownload.htm
It has xla routines for both Eigen Values and Eigen Vectors.
The other option is to go with a freeware PCA package - something like GINGKO http://biodiver.bio.ub.es/ginkgo/
I've always meant to try it out - but afraid I never got around to it.
Kevin,
I'm trying to avoid packages and the massive investment of time that learning a new language involves. Really I'm looking for techniques. I had thought EOFs (hence Eigen vectors comment), but on further digging all I find is stuff about finding principle components, not about establishing the degree of match of a pattern.
I'll probably email the people behind the AO index and ask what they mean by 'projecting' onto a loading pattern.
Post a Comment