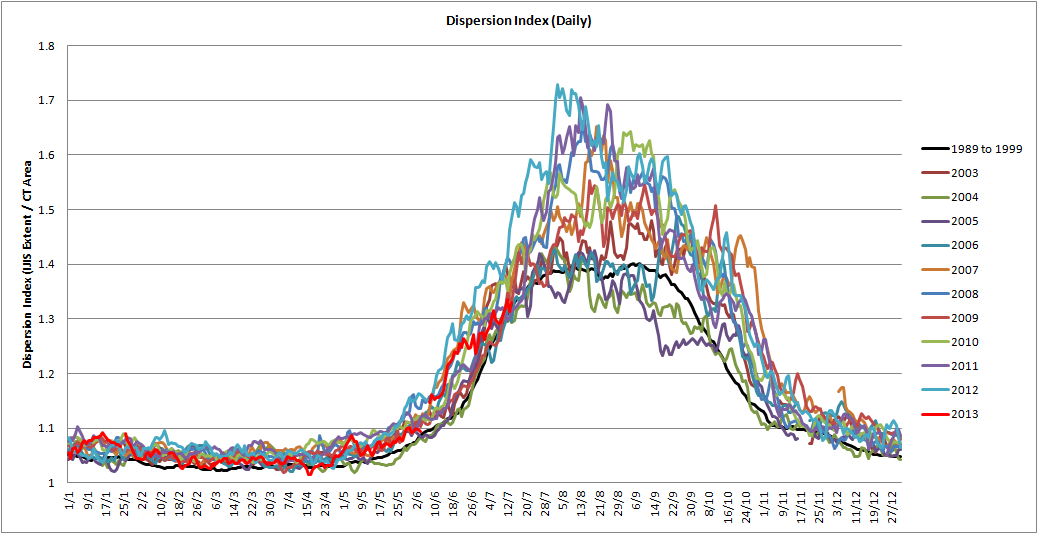
Previously I outlined how the ratio of Extent/CT Area shows a peak during the summer, click to enlarge.
I had attributed this to dispersion of the pack. However Wipneus has calculated the ratio of Area/Extent from data from AMSR2 data (Compactness), this was inspired by a comment from Dr Axel Schweiger of the PIOMAS team.
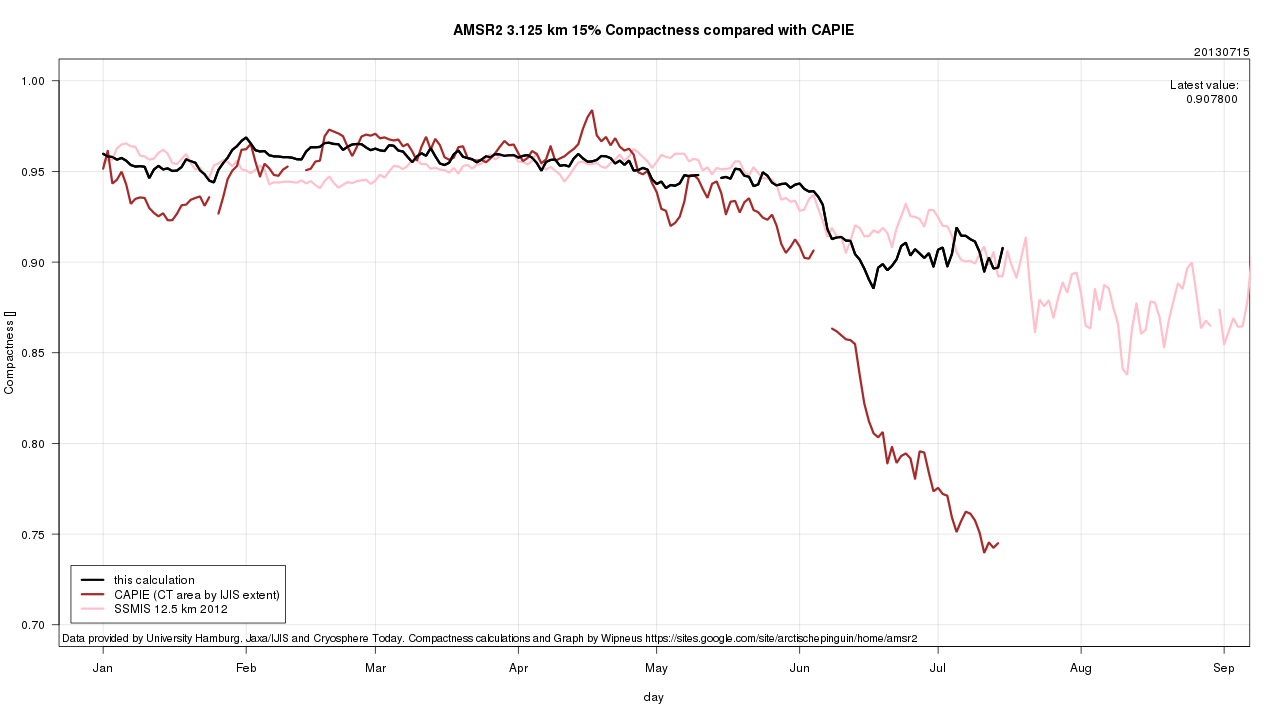
The divergence in May, begin of June is explained by CTArea not using the true grid cell area. It overestimates cells in low latitudes, underestimates high latitudes, is true at 70 degrees. The geography currently explains about 260k of the difference between the CTarea and AMSR2-area. Source.
In the comments of the previous post Peter asserted that a significant part of the CT Area drop was due to melt ponding and that CT Area is actually better viewed as an index of albedo. When first reading that I disagreed (posting as soon as I'd got up), by the end of that day I agreed. Wipneus has also compared extent from NSIDC and IJIS with his calculation of extent, and the agreement is close, this shows that the deviation over summer in the CAPIE index is not a feature of IJIS extent, but is due to CT Area.
So the summer deviation of CAPIE, compared with Compaction in the above graphic may be indicating the amount by which CT Area is skewed by melt ponds. Answering that question conclusively would be a massive project in itself. For the time being I'm happy to settle on CAPIE not being indicative of dispersion as such, more of a more general indication of ice state.
So is CT Area of any use? I still think it is, it's not a good representation of area, but that doesn't mean it's a useless metric. Note that the summer deviation in CAPIE is common to the 1980 to 1999 average, as shown by the black line in the first graphic. This means that it is showing things consistently across the full timescale 1979 to present. And as an index with a daily series from 1979 to the present that means it is still of use for tracking changes in the pack. This is shown in the August Average of CT Area and NSIDC Extent, which is used to calculate the ratio Extent/Area, which I previously called Dispersion Index.
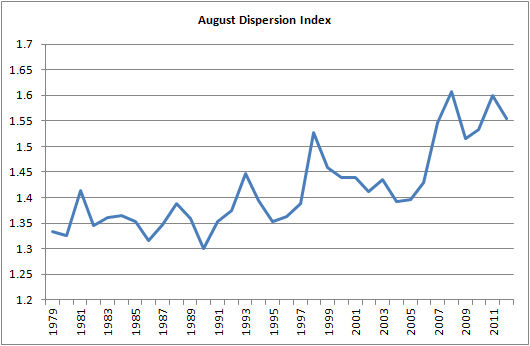
I still view that as a useful indicator of end of season ice state, as supported by the behaviour shown in the above graphic. But will need to change its name, I've got until September to decide what to call it, so there's no rush.
So what does CT Area show? It seems to be showing a mixture of ice area and melt ponding, so as Peter has claimed, viewing it as an indicator of albedo seems reasonable. Rather than using 'area' as a shorthand, it's best to specifically refer to it as the CT Area index.
Since I'm on the subject of CT Area, and finally something of note has happened, it's worth looking at my prediction for 2013's minimum using CT Area anomalies. This was based on the lack of trend of losses from 30 June to the minimum, link. The upper and lower bounds are marked by -SD and +SD (the 1.25 sigma bounds), although for the purposes of a vote at the Sea Ice Forum, link, I narrowed this to the central to -SD range (lower half).
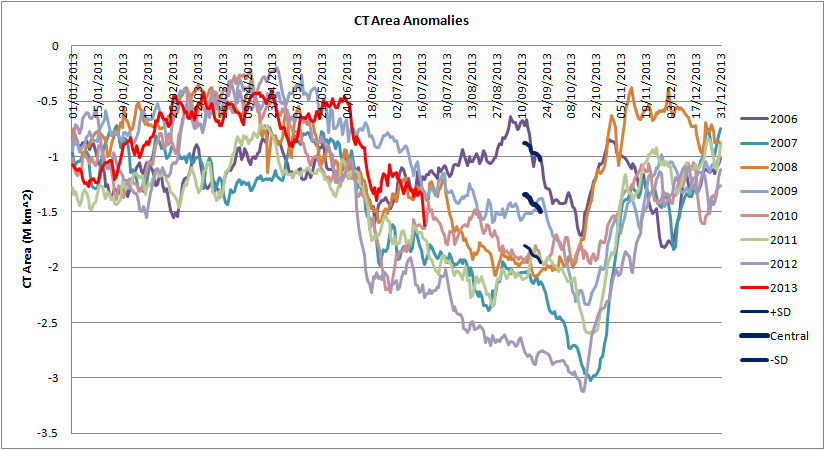
The last days data shows a big drop, which suddenly makes things interesting, merely tracking to within the prediction bounds is not interesting. I'm waiting to see if by the end of the season there is an unusual sigma deviation. As stated in the original post; to meet 2012 would require a 2.9 sigma deviation, which has never happened before.
4 comments:
Chris, a very recent paper (June 27) by D. Notz in The Cryosphere Discuss might be of interest: Sea-ice extent provides a limited metric of model performance
It's intended as a discussion of the correct metric to evaluate model performance, but has plenty of otherwise useful information vis a vis SIA vs SIE. I've only skimmed it so far, but I see the issue of grid size that Wipneus has highlighted is discussed.
Thanks,
The differences between Bootstrap and NASA Team (NSIDC) are striking. Regards IJIS/JAXA, Comiso developed Bootstrap, and IJIS states that their algorithm was developed by Comiso - does that make IJIS better than NSIDC???
I've passed a link on to Wipneus as he's working on area and extent.
I still prefer CT Area, but may start to incorporate IJIS Extent into future work.
Chris, I think area is more important - as do the scientists - but remembering that the uncertainties are large has to be considered.
What we see this year is lack of melt ponds (in general) during June - making it look like areas was way behind 2012. Now we see lots of melt ponds in July - giving the impression 2013 is catching up. The 'truth' is it probably was never as far behind as the numbers indicated. Likewise - much of the catching up is a mirage too :)
In a normal year I don't think it's really *that* important. We're still comparing like to like. This year, with it's atypical melt pattern, the differences are magnified.
Until we get sensors with 3m resolution instead of 3km we'll just have to learn how to work around it :)
I disagree about the lack of melt ponding this year in June. June 2013 had a 'cliff', and as I understand it the cliff is due to the spread of melt ponding.
I had thought (hoped) that the one day drop of 272k km^2 in CT Area a few days ago would herald a second 'cliff'. But since that losses have been average to below average; after the anomaly drop due to that one day loss, anomalies have been climbing (daily losses less than average).
I had hoped that atmospheric set up would be like most of the other post 2007 years. It's been very different, which invalidates direct reasoning on the issue of ice thickness. However in terms of loss rates this year is still behaving like a post 2007 year, without the aid of the atmosphere. That's significant.
Post a Comment