I have already shown the development of a unique atmospheric pattern since 2007 (link), due to its dipole nature (link) it may have a role in sea ice loss (link), but may in turn be driven by sea ice loss. These issues will be discussed further in the next post, assuming I can get my ideas together by then. I'm having to delay the next post because although NCEP/NCAR daily data is now up for 30 June, the monthly/seasonal series and timeseries data won't be updated for a day or two.
Using SLP over the high altitude dome of Greenland is not strictly kosher, but SLP fields are presented to illustrate action around Greenland as most people have less experience of looking at geopotential height plots.
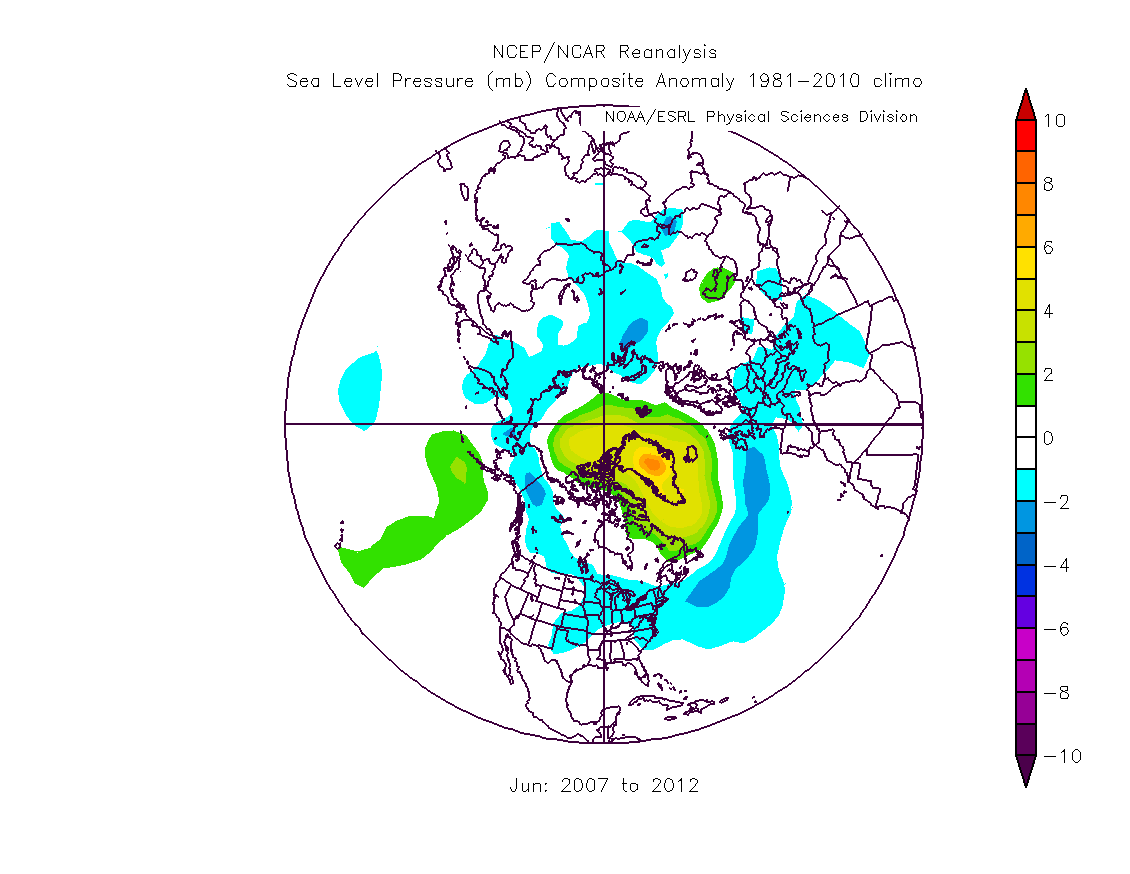
For context here is the average SLP for June in 2007 to 2012.
June 2004.
June 2005.
June 2006.

These three years were shown as typical examples of longer term variability in the Arctic region. With reference to the pattern revealed by average SLP for June in 2007 to 2012, the post 2007 years all show the pattern to a greater or lesser degree, apart from 2013, which appears to be the reverse of the post 2007 summer pattern, but is arguably more like a pre-2007 year, as shown by 2006 above.
June 2007.
June 2008.
June 2009.
June 2010.
June 2011.

June 2012.
June 2013.
No comments:
Post a Comment