I'm not posting to launch into a long boring discussion of the pack floe by floe. I think there's a more objective way to cut to the heart of the issue. The data I use are IJIS Sea Ice Extent index, data, and CT Area, data.
Over at Neven's Sea Ice blog there is a measure of compactness of the pack that's been used for some time, termed CAPIE, links. CAPIE stands for Cryosphere Today Area Per IJIS Extent. I've followed that for in reading that blog, but have long thought the index is upside down, because we're moving towards a more dispersed pack.
CAPIE is CT Area divided by IJIS Extent. What I've been following for a while, but somehow forgot to post in a blog post last year, is NSIDC August Sea Ice Extent divided by the August average for CT Area. This has been used to try to overcome weather, while keeping valid information about the sea ice state at the end of the melt season. The September averages are too late because they would include information about the first week or two of re-freeze.
Here is the August dispersion index from 1979 to 2012.
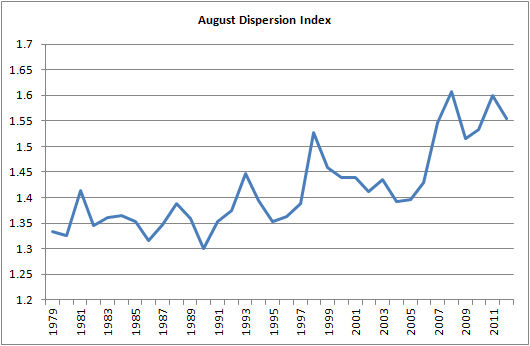
It can be seen that there is a strongly increasing trend of dispersion, heightened by a step jump following the 2007 crash.
This is to be expected with the continued thinning of the ice and increase in Open Water Formation Efficiency. Why it should appear in the ratio of Extent/Area may need to be explained. Wikipedia's page on Measurement of Sea Ice, link, states the following:
To estimate ice area, scientists calculate the percentage of sea ice in each pixel, multiply by the pixel area, and total the amounts. To estimate ice extent, scientists set a threshold percentage, and count every pixel meeting or exceeding that threshold as "ice-covered." The National Snow and Ice Data Center, one of NASA’s Distributed Active Archive Centers, monitors sea ice extent using a threshold of 15 percent.So for extent any region of over 15% ice concentration is tallied as full ice, whereas for area the same region will have a lower area value if it contains pixels with a concentration of ice less than 15%. This makes extent a somewhat blunt tool, but because of this more statistical confidence can be had from the measure of extent, which is why the professional scientists use it. However it can be appreciated that as the pack develops more open water in the form of loose floes in water, or cracks between floes, area will decrease more than extent will.
There is not such a clear trend of the Dispersion Index earlier in the melt season, but because the principle behind it (more fragmentation means a higher ratio) is so simple it seems reasonable to apply this to the current state of the pack.
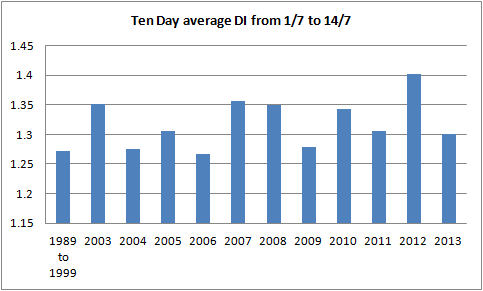
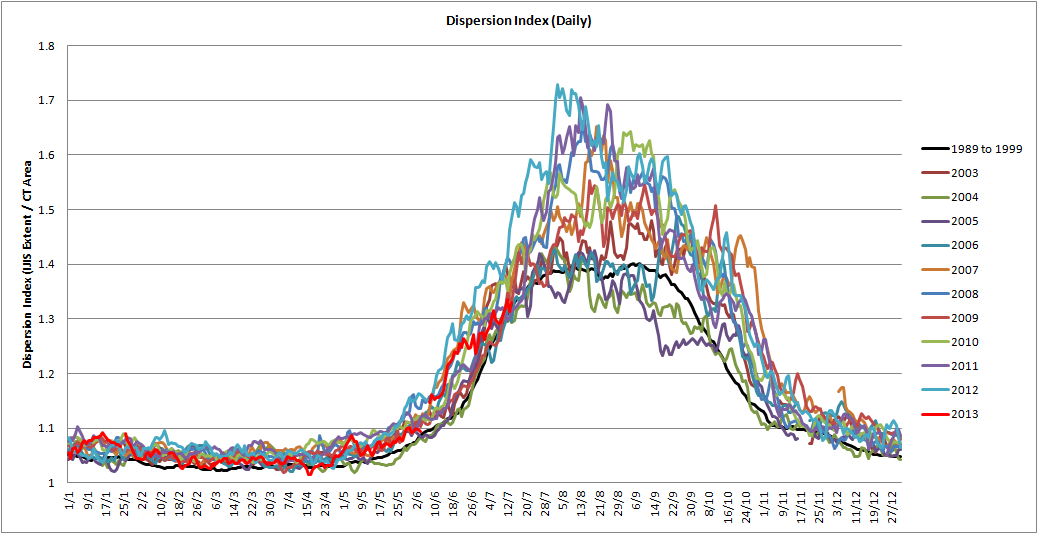
The Dispersion Index for the first two weeks of July does not support the idea that 2013 is exceptionally dispersed. However as the plot of daily dispersion index, or inverse of CAPIE, shows, it is only from the end of this month that the spread should increase leading to the rising trend in August Dispersion Index.
This is not a graph I intend to update. Click to enlarge.
16 comments:
You may be with me, but I'm not with you. Or at least, I am with you, but not for the reason you think. :-)
I think CT area (and indeed any passive microwave data) are next to useless for assessing fragmentation, since you have the confounding factor of melt ponding. You've got some very pretty graphs there, but they have nothing to do with how dispersed the ice pack is.
However, I also thing fragmentation is much less of a factor than everyone in the blogosphere says. They blither on about slushies compared to ice cubes, all of which shows nothing other than that they have no physical intuition of the scales and shapes involved. Sea ice is a sheet, plain and simple. It's a couple of metres thick and hundreds to thousands of metres wide. Edge melt is insignificant as a proportion of the total until the width is of the same order of magnitude as the thickness - whether the floes are 100m across or 10km across matters not at all.
What does matter, however, is the overall albedo within the pack. Open water outside the pack will absorb extra energy from the Sun, but will not translate that into efficient melt as there's no good way to get the energy from A to B. The main effect will be to delay the re-freezing and slow thickness gain in the winter, which is a completely separate issue. In contrast, excess energy absorbed by open water within the pack *will* translate into more melting, because it's immediately adjacent to the ice.
That's why your graphs are meaningful - not because they tell us much about the fragmentation state of the ice (since they don't distinguish between leads, small polynyas and melt ponds), but because they are a reasonable proxy for the albedo of the pack.
The problem with looking at it from the point of view of albedo is that August volume loss is decreasing strongly.
http://farm4.staticflickr.com/3691/9208490559_9cc25fceb5_o.png
I agree that melt ponds will be a factor. But I understand that melt ponds are mainly skewing area in June. By August the pack is typically in a broken state, what people are calling slush.
I suspect that the reason there is little change in late summer volume and area loss is that the climatological state and recent states are not the limiting factor to ice loss, insolation is.
"The modeled partition of top versus bottom melt closely matches observed melt rates obtained by a drifting buoy. Bottom melting contributes about 2/3 of total volume melt but is geographically confined to the Marginal Ice Zone, while top melting contributes a lesser 1/3 of volume melt but occurs over a much broader area of the ice pack." Steele, M., J. Zhang, and W. Ermold (2010), Mechanisms of summertime upper Arctic Ocean warming and the effect on sea ice melt, J. Geophys. Res., 115, C11004, doi:10.1029/2009JC005849
What this year has done is turn large areas north of 80 into marginal ice zones.
Peter,
Actually I'm more or less in agreement with you now. I'll try to post either an addition to this post or a new post in this night or the next (work allowing).
Kevin,
It's been ages since I read that paper, but isn't the marginal zone the pack periphery? I'm not convinced it's possible to treat the zone between Laptev and the N Pole (presume this is what you're hinting at) the same as the region of the ice edge adjacent to ocean warmed well above freezing by insolation.
While open water can warm to well above freezing, the close proximity of ice in the pack pegs temperature at freezing. I've been pondering the difference in heat flux from ocean to ice when temperatures are near equal (ice pack) or the ocean is warmer (open ocean). Bearing in mind that heat flux is proportional to temperature difference.
Chris, wouldn't any area of open water absorb an increased amount of energy?
Doesn't that energy have to go somewhere?
In the central arctic it hasn't gone towards increasing the air temperatures - so where does it end up? Unless it goes straight down and increases ocean temps at depth only it is going to find it's way to the ice - it's unavoidable.
This is the essence of albedo changes. Change the albedo and change the energy flux. Increase the energy absorbed and you *have* to increase the temperature of *something* ...
Yes it does. But surely influx of warm water from open ocean, having warmed over a period, has a greater potential for bottom melt than does say a 50% concentration anomaly (like Laptev -> Pole)?
This is why I'm not convinced that region is equivalent to the marginal zone. I see it as somewhere between full ice within the pack and the marginal zone.
Chris - IMB Buoy 2012J is located right in the low concentration zone. Buoy locationsIf we look at thermistor string data for buoy 2012J we see these temperatures for the first 15 thermistors (degrees C):
T1 0.65
T2 0.89
T3 0.38
T4 0.13
T5 -0.02
T6 -0.38
T7 -0.69
T8 -1
T9 -1.32
T10 -1.51
T11 -1.69
T12 -1.69
T13 -1.76
T14 -1.71
T15 -1.76
It should be pretty obvious that the ice/snow surface has to be close to T5 -- since it's temperature is nearly 0.0C.
If we look at the differences
T5-6 = 0.36
T6-7 = 0.31
T7-8 = 0.31
T8-9 = 0.32
T9-10 = 0.19
T10-11 = 0.18
T11-12 = 0.0
I believe the thermistors are 10cm apart. The thermal gradient of the ice appears to be 0.31C/10cm.
The bottom surface location is less obvious. It shouldn't be any higher than T9 and no lower than T11. My guess here is that we're looking at somewhere between 9 and 10. Fresh water has melted and mixed with the ocean salt water to raise the near surface temperature slightly.
This leaves us with less than 50cm of ice left. That equates to about 1.3 meters of bottom melt since June 1st when the bottom surface was likely around T22.
If my reasoning here is sound, then we're not just seeing ice melting per a marginal ice zone, but *enhanced* melting - perhaps due to the higher insolation received this far north.
I don't know Kevin, without writing a macro I can't get rid of all the lines without data, and after an hour pissing around trying to overcome the screw up caused by the, frankly bizarre, American date system used by the data - I'm now not in the mood to dig further.
There's a thread on this data over at the sea ice forum, been pondering blogging on it.
http://forum.arctic-sea-ice.net/index.php/topic,327.0.html
Kevin,
Just been having a look at that data. I'm not convinced that there is a detectable snow layer. Scrub that - I think you're right see end of comment.
With reference to this graphic. I've taken a mid March data point and the most recent.
Note the dates on that are a bit messed up - but the blue plot cannot be for 3 Aug because of surface temperature, it must be 8 March - this is the problem I've been having in Excel with the dates!
In March two of the thermistors register as near, as damn it, ambient air temperature, it is only after these thermistors that the temperature starts to rise. I suspect these are actually above the snow line. There is then an inflection point in the warming with depth profile. Snow is a better insulator than ice so the rate of warming with depth should be higher for snow. The snow I identify is between T3 and T6, snow surface for that date/time is given as 23cm, I think those figures tally with the 10cm thermistor increment.
The situation as of 21 July is rather more tricky. There seems to be an inflection around T11 or T12, if this can be taken as the ice/ocean interface the thickness loss is of the order of 70cm.
After plotting and annotating that the implication of the buoy dropping into the ice isn't satisfactory. You're right to point out the region between T3 and T5 where the temperature hugs zero degC. That this is snow seems reasonable, the proximity to zero suggests to me that it's wet snow.
If my interpretation isn't totally duff this implies a thinning of 50% due to bottom melt at this site.
I'm going to have another look at the other sites I've downloaded.
Chris, The maximum thickness the sounder showed was 1.94 meters - most recently on May 30th. On May 30th it gave consecutive thickness readings of 1.94, 1.94, 1.84, 1.84, and 1.84. The final reading for May 30th is blank - though the bottom reading is consistent with the 1.94 readings from earlier in the day.
We're both coming up with somewhere around 50 or 60 cm left (T5 to T10 or T11).
That means we've lost 1.3 meters off the maximum thickness.
I only calculate max thickness at around T22 - or 1.7 meters - but that's still a lot of melt.
Kevin,
While looking at the thermistor data last night I wasn't impressed with the sounder data (thickness). I need to spend some more time looking at it though, and I'm determined to have a night of idleness tonight. But my reading of the thermistors in March is not congruent with the sounder thickness.
Do you post on the forum as Ktonine?
Yes, I'm ktonine (or kto9) anywhere I exist on the internet :)
I have a recent posting in 'What the buoys are telling us" looking at 2012H both before melt started and what we see currently.
I found reasonable agreement (within 20 or 30 cm) between thermistor data for the before melt timeframe. Currently I think the sounder and thermistors (on 2012H) are measuring totally different physical locations or the sounder includes melt ponds as part of ice thickness.
Thanks,
I'll have another look at that data over the weekend. But as I'm facing a string of long days on site, I won't have anything substantive to say before then. I agree though that the sounder data looks more problematic than the thermistor data, despite issues like drainage of melt ponds around the thermistors.
Sounders will measure to the top of melt ponds - it's just sonar, after all, and much more of the sound will reflect at the air/water boundary than the water/ice boundary. 2012 H levelled off for a while (i.e. measuring to the top of the pool) but has now dropped again, so presumably the pool has drained a bit.
Detecting the top surface from thermistors is comparatively straightforward - the bottom surface much less so once the ice becomes isothermal. That wiggle in the curve at ~T11 could be the ice/water interface (but you then have to hypothesise a gradient of salinity in the next ~30cm of sea water, to match the dropping temperature. Alternatively, that wiggle could match the transition between ice of different ages / different salinity: the buoy was placed in low-salinity MYI but will have higher-salinity FYI formed underneath by congelation. The minimal thickness measure by the sounders in Oct was ~70cm, which corresponds to the lower boundary you're calculating from the thermistors.
Chris, I don't do much calibration anymore, but I have a Scope of Accreditation audit for our sister laboratory in Florida in 10 days. I'll fly down a day or two in advance, but I'm trying to rewrite most of the uncertainty budgets and reconcile them with Scope changes from where I work here in our main facility in Milwaukee.
Since our Milwaukee lab calibrates most of our Florida facility's standards, every change I make in Milwaukee affects the Florida budgets. So I end up writing two similar, but different budgets - and have been staring at these different numbers for so long (9 months of almost nothing but measurement uncertainties) that I literally have to read the document title while working on them to keep things straight. By the time I go onsite in 10 days I think it will be a relief. Of course I'll probably have a whole week to vegetate when it's finished and then start on the next round :)
Oh well, at least it's job security ....
I did post a comment here a few days ago, but it's not here now. :(
Peter,
Having been looking at the thermistor data I think it's probably not a bad way of gauging ice thickness, although it's definitely easier in mid winter.
Kevin,
I don't envy you. I'm happy to be doing hands on cal, I've already told the MD I don't want to do my boss's job when he retires.
Post a Comment