Atmospheric Blocking is caused by static high pressure systems that block the path of low pressure systems, which are carried from west to east by the Jetstream, it is the blocking of such flow that defines a blocking event. Semi-permanent highs such as the Azores High are not blocking in nature. These events are associated with events such as the 2003 European Heatwave, the 2010 Russian Heatwave, and the 2009/10 severe winter. So it is apparent that changes in blocking events could have implications of a practical, rather than purely scientific, nature.
The blocking data is from Dr Anthony R Lupo & Colleagues, available here. Temperature and geopotential height data are from NCEP/NCAR, available here, grids have been area weighted. All data used is for the Northern Hemisphere. Data were originally downloaded in late December 2012, this affects the end date of some calculations as December 2012 falls in the calendar year 2012, 2011 is used as the end year in some calculations. I normally link to papers in a reference list at the end of each post, I've not done that for this post because I can't claim to have properly read and considered the papers linked to in the text.
First place to start is to look at time series, the data is provided as timeseries of individual blocking events, the variables that seemed of most use initially were length of blocking event (days) and intensity of blocking event. Blocking intensity is as defined in Wiedenmann et al (2002). Geopotential height (GPH) is the height of a given pressure level in the atmospheric column, Wiedemann et al use the height of the 500mbar pressure level, taking the peak GPH at 500mb within the blocking pattern they scale this proportionally to what they term a representative contour. The representative contour (a single number) is derived by tracking across the line of latitude at which GPH is maximum, the result is that the BI gives a measure of the GPH gradients in the region of the blocking high.
A lot of these graphics are big, just click on the graphics to enlarge.
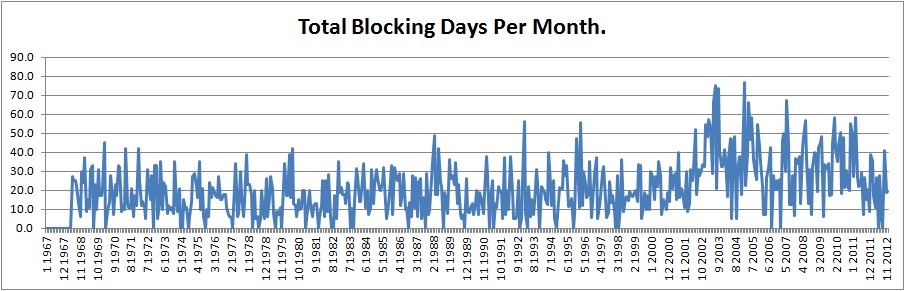
Fig 1. Total Blocking Days per Month.
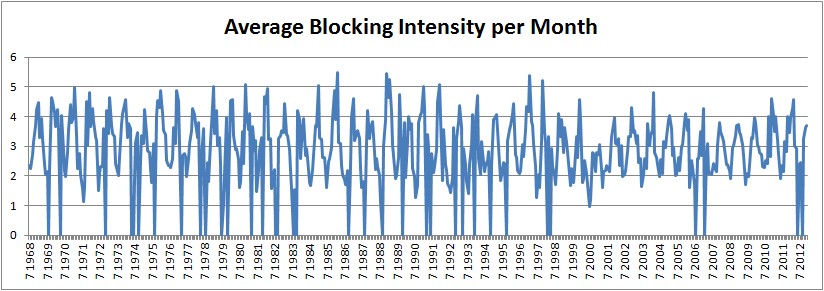
Fig 2, Average Blocking Intensity per Month.
It's clear that something is afoot; since around 2000 there's been changes in both total blocking days and average intensity per month, notable is that months without blocking events become almost non existent after 2000.
Concentrating on the total blocking days per month, what change has caused this post 2007 shift? To avoid incomprehensibly spaghettified graphs I've broken down the data into seasons, using meteorological seasons:
Winter - December, January, February. DJF
Spring - March, April, May. MAM
Summer - June, July, August. JJA
Autumn - September, October, November. SON
These also line up with seasons of Arctic sea ice and consequent Arctic climate, which will become relevant further on in this post.
There are two factors that could cause a change in the total of blocking days each month; a change in the average length of blocking events, and/or a change in the number of blocking events.
Firstly the number of blocking events per month, which is more directly comparable with the first two graphs.

Fig 3, Number of blocking events, by month.
Now seasonal breakdowns.
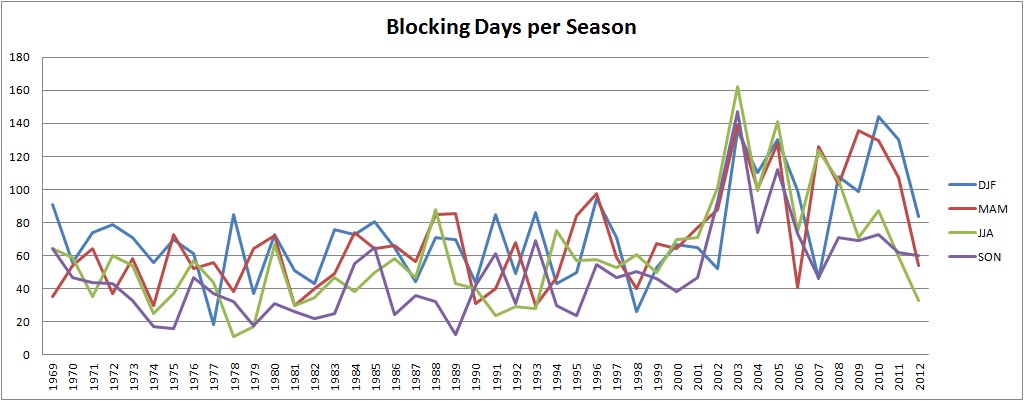
Fig 4, Number of blocking days, by season.
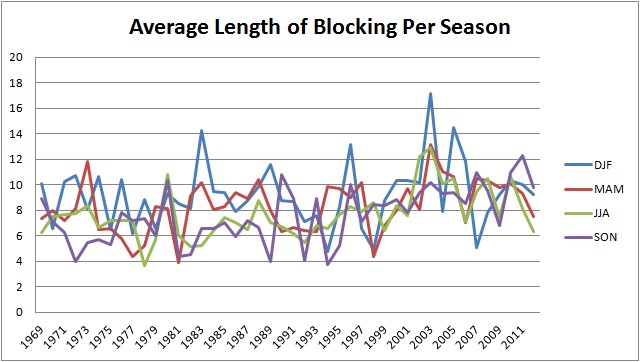
Fig 5, Average length of blocking events, by season.
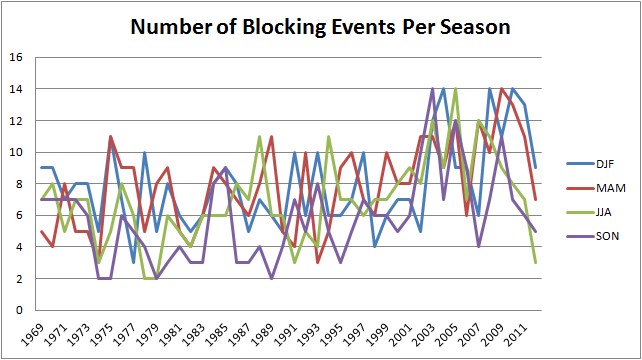
Fig 6, Number of blocking events, by season.
The increase in blocking days seems to be mainly due to an increase in the number of events.
The scale of the change can be seen in figure 4, but can also be appreciated from a histogram of distributions of total monthly days. This is calculated by calculating the distributions of the total number of days of blocking per month for two periods; 1968 to 1999, and 2000 to 2012. Then normalising the resultant distributions to allow comparison by expressing each total as a fraction of 1, where 1 is scaled to the total number of days.
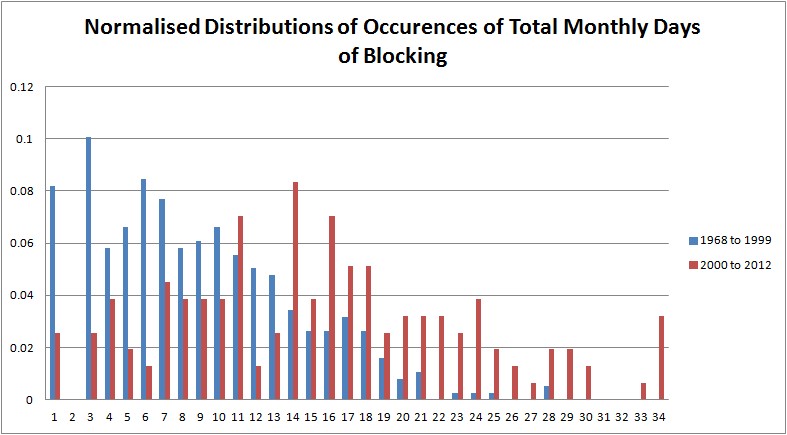
Fig 7, Normalised frequency distribution of total blocking days per month.
Dr Lupo's data also includes the starting longitude of each event. So we can look at an aspect of the geographical distribution of both duration and intensity of each event.
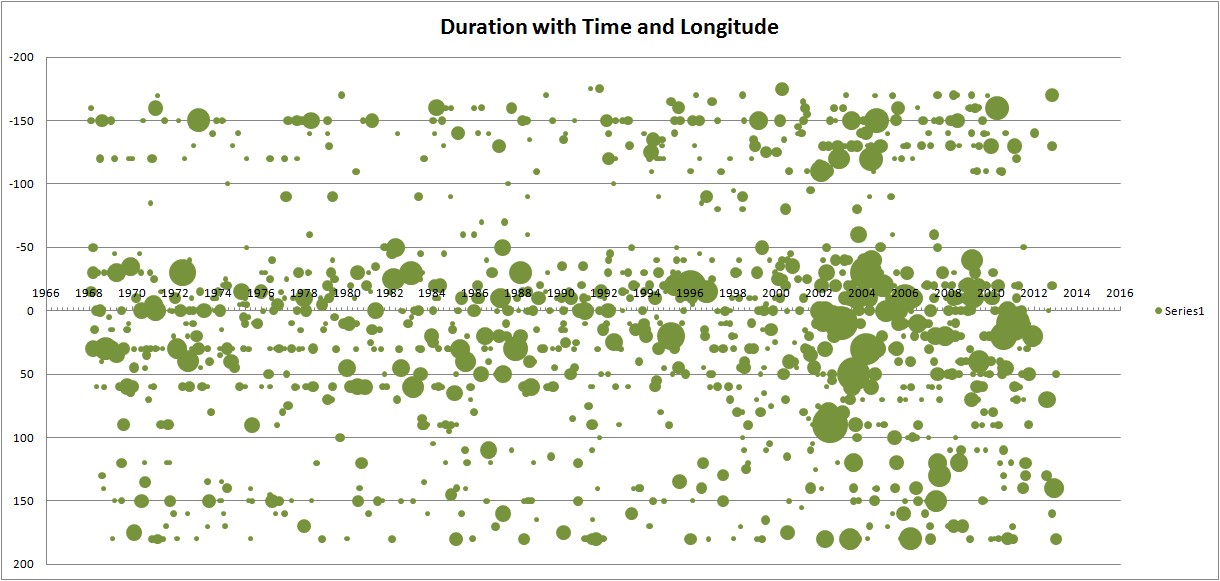
Fig 8, Time and longitude, with width of each data point relating duration.
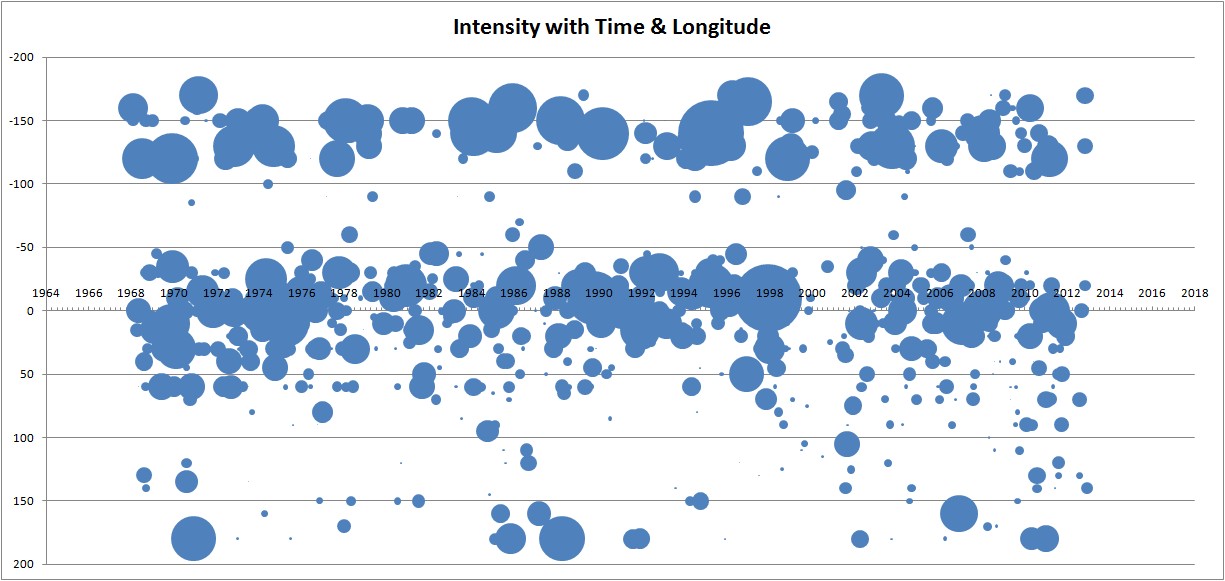
Fig 9, Time and longitude, with width of each data point relating intensity.
In both I've plotted negative longitude above the axis, positive below. This relates to the Americas being above the axis, Greenwich (UK) at zero, Europe and Eurasia to Asia below the axis, which seems to me to be the most intuitive way of presenting. Limitations of Excel prevented me from rotating those to up-down.
What's odd to me is the clear decrease in intensity at the same time as an increase in duration after 2003. These changes are apparent from earlier graphs but they seem to be concentrated across Europe into Eurasia, the 2003 peak is clear, but the general increase in duration and decrease in intensity is also clearly not a transitory phenomenon around 2003 but continues to the present, mainly affecting Europe, but also apparent in the American sector. Also, what happened to intensity in 2001 and 2002? This seems to be reflected in figure 4 as well.
Blocking intensity itself is strongly seasonal, being greatest in the winter (when polar to mid latitude temperature gradient is strongest) so I've calculated the monthly average for the period 1951-1980 (GISS baseline) and thence calculated anomaly from the average. Here is a time series of seasonal anomalies of intensity.
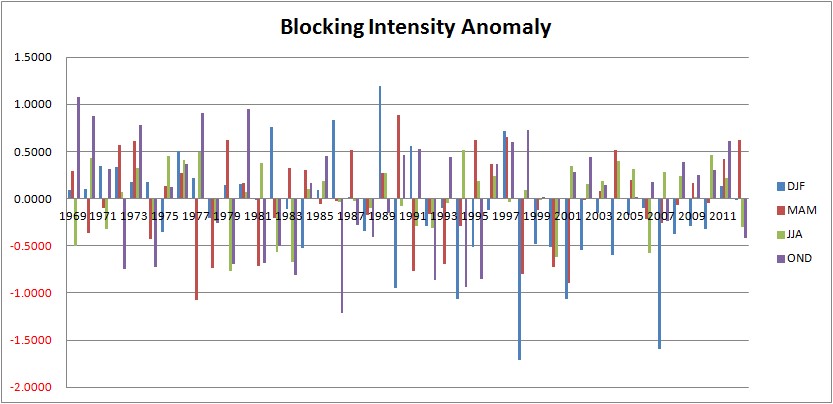
Fig 10, Timeseries of seasonal average intensity anomalies (baseline 1951 to 1980).
Blocking intensity has decreased in all seasons after 2000, with a tendency towards small generally positive anomalies.
***
So what is causing the post 2002 change in blocking duration and intensity. My first thought was the work of Francis & Vavrus, "Evidence linking Arctic amplification to extreme weather in mid latitudes" 2012. They identified changes in the Jetstream due to the differential warming of mid latitudes and the Arctic, changes that lead to increased latitudinal amplitude of Rossby waves on the Jetstream, associated with slower moving weather patterns. This could give rise to increased duration of blocking (which is small but plausible - fig 5), increased number of blocking events (strong - fig 6) as the conditions giving rise to one event persist giving rise to further events, and possibly a reduction in blocking intensity (strong - fig 8) due to gradients being lessened with larger Rossby waves. Notably figs 7 & 8 do not suggest (to me) that any strong change in wavenumber or phase of Rossby waves is a cause of the post 2002 changes, by which I mean the longitudinal distribution remains largely the same before and after 2002. However that conclusion could be wrong with blocking events in the given regions being tied to geography, notably continental landmasses adjoining the Atlantic.
I've used NCEP/NCAR to generate monthly time series of average temperature over the following bands:
Arctic = 90degN to 65degN
Mid Latitude = 65degN to 25degN
Northern Hemisphere = 90degN to 25degN
Difference in Temperature (DIT) = Mid Latitude minus Arctic
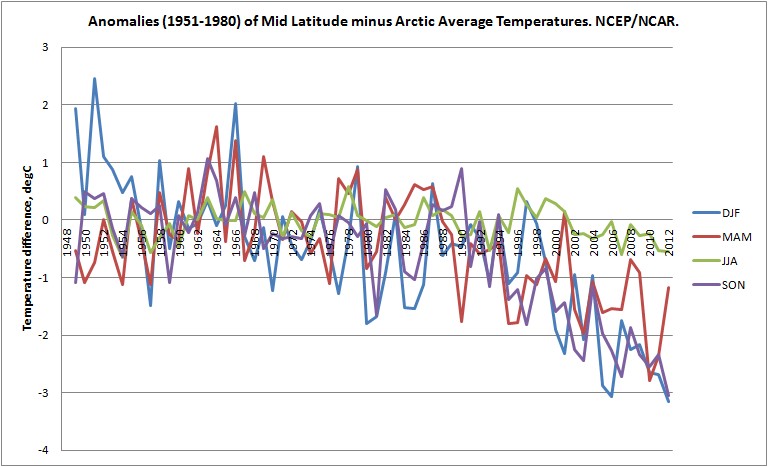
Fig 11, Seasonal averages of temperature difference between mid latitudes and the Arctic (DIT).
The downward deviation into this century is due to the accelerated warming of the Arctic, the lack of such a substantial downward deviation in JJA is due to the melting of sea ice, energy that would go into sensible warming in the Arctic goes into melting ice. Comparison of figs 4 & 6 with fig 11 seems to suggest that what is going on is not solely related to the DIT change. However it is worth looking at scatter plots of temperature difference and blocking days, per season, and per year.
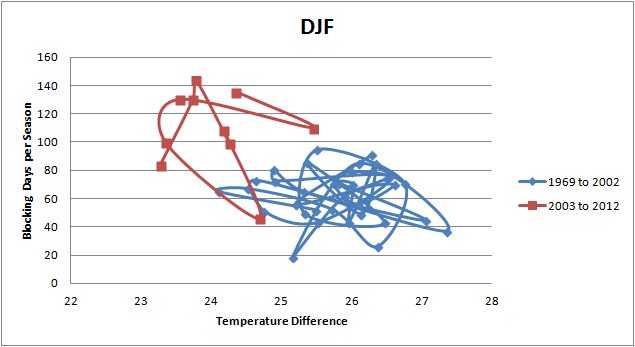
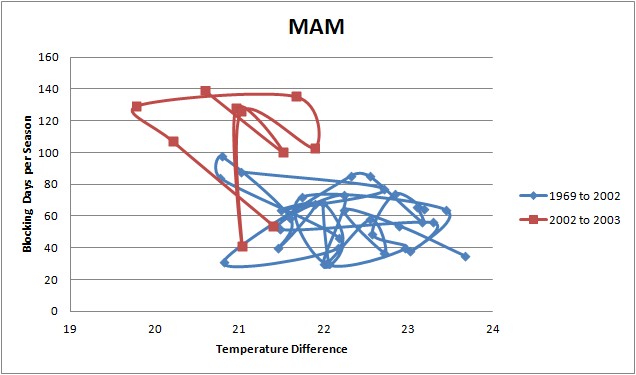


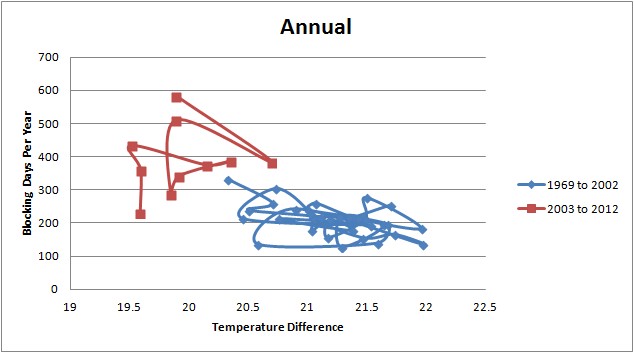
Figs 12a to e, Scatterplots of temperature difference (DIT) against number of blocking days.
Correlation does not imply causation without a viable mechanism, in which case it can be taken as supportive together with other evidence. The differences between the post 2003 period and the period before reflects the massive Arctic warming in tandem with the increase in blocking events. So is there any reason to suspect temperature may have a role? As mentioned above figure 10, the seasonal cycle shows the greatest number of blocking events in winter, when the temperature difference is greatest, however what I've been looking at is a decrease in the DIT and suspecting a link to an increase in blocking. That noted, what I've seen of the literature suggests a role for Northern Hemisphere temperature in blocking days, for example this white paper from Mokhov et al. They reference earlier work, Lupo 1997, which shows using a model that warming leads to an increase in events which may be weaker and more persistent.
Comparing a control experiment (CO2 330ppm) and a doubled CO2 experiment, Lupo et al 1997 finds that:
...in general, blocking anticyclones were more persistent but weaker than their counterparts in the control experiment. All other characteristics of the overall sample such as; frequency of occurrence, size, preferred genesis locations, and annual variations in size and intensity, were generally similar to the control experiment.The major difference between this statement and what is seen post 2000 is that the number of events per month (frequency of occurrence) has gone up substantially, as seen in fig 6.
To see whether the temperature and the total annual blocking days are possibly related requires that the trend be removed. Without doing this any correlation will be stymied by concurrent trends; during this century both temperatures and blocking days have increased together. Using annual data I've removed the trend by taking inter-annual differences, both in temperature and total number of blocking days. Then I've calculated correlations over different periods between annual blocking days and the four different temperature indices.
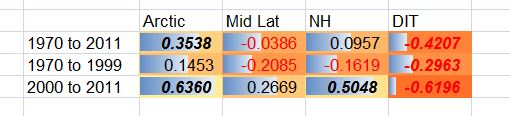
Fig 13, Correlations for the four different temperature indices against annual day count of blocking. Emboldened and italicised are statistically significant at the 95% level, ref.
For northern hemisphere temperatures (NH) in fig 13 it is only the post 2000 period that is statistically significant. The Arctic is statistically significant for the whole period from 1970, and for the post 2000 period. However I view it as meaningful that the temperature difference between Arctic and mid latitudes (DIT) is statistically significant for all three periods. Note that this is a negative correlation which fits with the relationship seen in the source data (not de-trended) that as the DIT reduces blocking increases.
At present I still think it very plausible that Arctic warming is playing a role, and the way it could play a role seems to me to be via the change in temperature gradient between mid latitudes and the pole, the gradient that drives atmospheric circulation. It is interesting that there seems to be no connection with the new Greenland centred summer circulation pattern (Summer Arctic Dipole). But Zhang's found that the Arctic Dipole, termed the Arctic Rapid Change Pattern in that work, arose from around 2003, ref; is there a connection? And what role does Cohen's finding of a lack of winter boreal warming due to low AO index play? Figure 4 is interesting in this respect with a reduction back to normal levels of blocking in Summer and Autumn, but maintained high levels in Winter and Spring.
I really need to do some reading and think about this matter.
Thanks to Steve Bloom for putting me onto this data, and to the originators of the data, Dr Anthony R Lupo & Colleagues, for producing the dataset and making it publicly available.
Note 1, I've also looked at changes in the difference between GPH for mid latitudes and Arctic. There are no substantial changes in GPH difference (calculated as anomaly due to large seasonal cycle, and consequently no significant behaviour for scatter plots, DJF, MAM, JJA, SON, Annual.
Note 2, Some cursory checking against ENSO, AO, PNA, AMO, did not suggest any of these play a role.
14 comments:
Hi, thanks for the post, it's very interesting! Just wanted to note that Anthony Lupo has been a speaker at Heartland's ICCC in 2009, and has been paid by Heartland 750$/month for work on the denialist NIPCC report. He has signed a plethora of denialist petitions such as the recent Qatar open letter, stating »The hypothesis that our emissions of CO2 have caused, or will cause, dangerous warming is not supported by the evidence.«
This of course doesn't mean that his peer-reviewed science is bad, just a heads up to be alert when reading or promoting him.
Excellent. And I hope for everybody living on an island at 0°W that blocking = rain is not written in stone.
Capt Pithart,
Thanks for the info. I tend to ignore denialists these days, seeing them as largely irrelevant. Whatever the individual's views his data is interesting.
Arcticio,
Blocking tends not to mean rain because it blocks out the weather fronts that mean rain. But this year's high rainfall and flooding in the UK are just the start due to the new summer circulation pattern.
Impressive stuff, Chris!
Respects. An old finnish proverb came to mind, can't remember the exact words but it stated something like, "easters continue for 3 days, if not three, then six, if not six then nine, if not nine then 12. if they continue for longer it's best to make more wood for the spring will be late." I'm not asking to confirm or debunk this but it would be funny if a proverb from 19th century would prove correct. Are you planning a scientific article about this?
Wow, Chris, I'm impressed! Thanks so much for diving into this.
I have a number of half-formed comments I'm thinking about, but for now I just have a couple of questions and a couple of links:
The post mentions the technical note but not the paper. Have you read the latter? I tried, but didn't have a lot of time to do so and got rather frustrated trying to extract the main points from the translation. I plan to take another stab at it, but I suspect you can do better. FYI Lupo says the real translation will be available in two or three months.
How sensitive is the analysis to the way blocking events are defined?
On Twitter just now O.Bo linked to an in-press paper about SSWs that at a quick glance appears to make considerable progress, although causation of blocking events is a little orthogonal to your present effort.
Finally, Leo Hickman linked to an interesting article in the Indian edition of the MailOnline, which I hadn't known even existed and is oddly not linked in any obvious way from the main Mail site. There seems to be some blocking event relevance, although the papers look to be a little hard to locate. In any case, there does seem to be a lot of Indian interest in this stuff.
Also, I can't resist wondering whether the third photo amounts to some sort of editorial comment directed by the Indian Mail employees toward their British overlords. :)
Oale,
The proverb is interesting and may have a kernel of truth: Long spells of easterly winds in Finland could be associated with low index AO winters. In such a set up the easterlies dominate the weather throughout the winter season - could cause late springs.
No I'm not planning any articles elsewhere. I am just an amateur.
Steve,
If I hadn't found it interesting I wouldn't have got so into it.
Yes the method used to define blocking does change the outcome. I've read one paper that finds no trend, but they use a different method for indentifying blocks. However this issue doesn't seem to me to address the substantial changes throughout the recent decade. If one applies a method consistently, and automation dictates consistency, then changes in the resultant data set cannot be argued to be due to the method. They must be in the underlying data. One might argue that _what_ a given method shows could be questioned, however one cannot argue that a regime shift is not in the source data.
Thanks for the SSW paper, it's on my reading list, although I've read the abstract. I've been seeing vortex splitting in NCEP/NCAR recently by messing around with the scaling so that activity at 50mb level in the Arctic stands out. I'll post a video of such an event in a while.
I think you missed a link to the press article you mentioned.
Here's a video of what I think is a vortex splitting over the Arctic.
http://www.youtube.com/watch?v=wTgd4wxi-ww&feature=youtu.be
Not sure how common these events are. The vortex fades out at the end as the overall GPH thickness falls into the cold of late winter.
Here's the MailOnlineIndia article. The third photo remains, although come to think of it maybe that sort of thing is just DM SOP.
To all Jennifer Francis-fans: Here's an interview on the SciencePoles website.
Clarification to my comment about applying a method consistently not creating changes in a non changing dataset - this only applies if the method has no memory. As far as I can see the Wiedenman method has no memory.
Neven,
Thanks for that.
Judah Cohen, Francis/Vavrus and perhaps others doing work on this general subject have fresh AMS meeting presentations which will be available in two weeks or so. These will include videos and ppts AIUI.
In addition to the apparent alignment of NH blocking event increase and Arctic sea ice reduction, we have the flattening of global surface temps and and reduction of NH snow cover, all with a step change around 2002. (Did I miss anything?) Is this all a consequence of a poleward-compressed and destabilized atmospheric circulation allowing an increased rate of heat advection into the Arctic?
Steve,
"In addition to the apparent alignment of NH blocking event increase and Arctic sea ice reduction, we have the flattening of global surface temps and and reduction of NH snow cover, all with a step change around 2002. (Did I miss anything?)"
There was also Zhang's finding of the AD becoming more dominant around 2003.
We could also include the post 2000 abatement in global warming in datasets that exclude the Arctic - e.g. CRU. Foster & Rahmstorf and Kaufman et al however attribute to ENSO/Solar/Sulphates.
"Is this all a consequence of a poleward-compressed and destabilized atmospheric circulation allowing an increased rate of heat advection into the Arctic? "
Part of the Arctic warming is actually due to sea ice, a good part of the warming in the all seasons is linked to the reduction of sea ice. e.g. Screen & Simmonds "The central role of diminishing sea ice in recent Arctic temperature amplification" PDF here I must confess to having lost track of the atmospheric heat transport issue following the Graverson discussion - the impact of different datasets on the conclusion. So the best I can say is; I don't discount it, but the warming is rather surface based which seems to favour a dominant role for sea ice, rather than for increased atmos heat transport. This doesn't mean atmos and ocean transport changes are negligible.
At present I'm picturing:
Loss of Arctic sea ice. -> Regional warming -> Further loss of Arctic sea ice -> Change in polar to mid lat temp gradient -> impacts on mid lat weather.
While...
Warming from loss of sea ice reduces snow cover in spring -> possible linkage with summer atmospheric circulation shift.
Increased humidity from lack of sea ice -> greater rate of snowfall over Eurasia -> reduction of boreal warming trend and cold outbreak events (although sea ice may have more direct role in some events).
I'd better stop before I complicate, but that's the rough framework I see.
Post a Comment