There's loads in this, especially as it adds a third year to the post 2010 series, and augments the PIOMAS series data (here) and Cryosphere Today Area (here) I use so often. There will be time enough to analyse in the rest of the spring before the season gets really started. But here's some initial graphics.
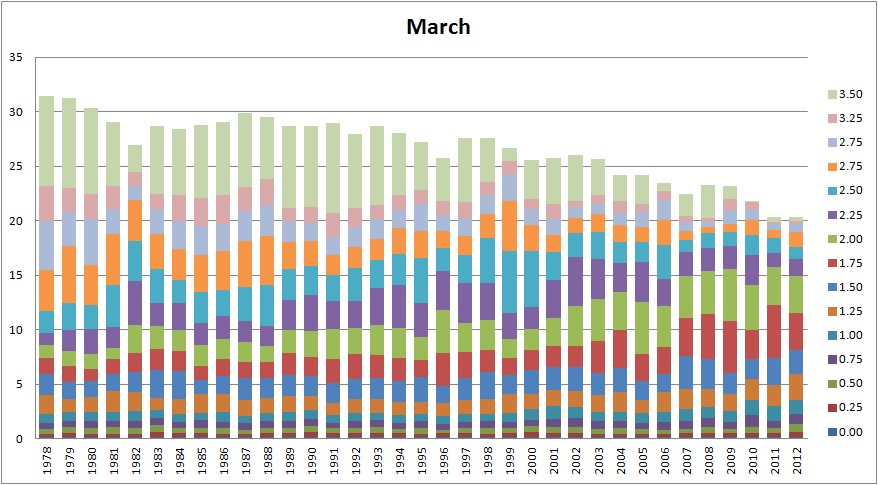
First 0.25m breakdown of volume, i.e. the vertical axis is the volume, and the colour categories are thicknesses of ice in 0.25m splits, giving an idea of how the total volume is contributed to by various thicknesses of ice - although the picture is a bit more nuanced than that. What this shows is the volume contribution of grid boxes reporting certain average thicknesses, so the volume for a thickness of 2m is the volume sum of grid boxes reporting thickness of 2 to 2.49999m thick.
I've broken this down into the four cardinal months of the solar cycle that drives Arctic sea ice, although technically PIOMAS volume reaches maximum in April, the difference between March and April isn't really qualitatively significant. Also you may find difference between the overall volumes and the PIOMAS series, first these are monthly averages, second the grid box areas I'm using aren't perfect, and so far it's proven beyond my wit to make them better.
March
June

September

December
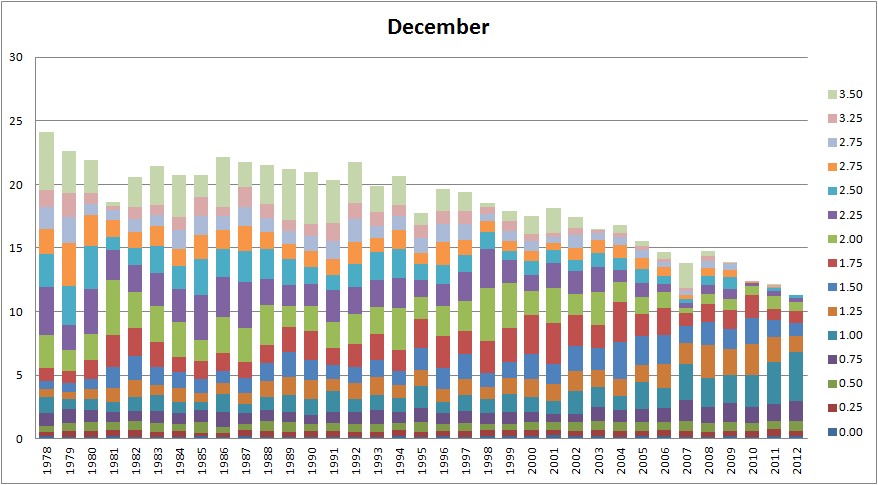
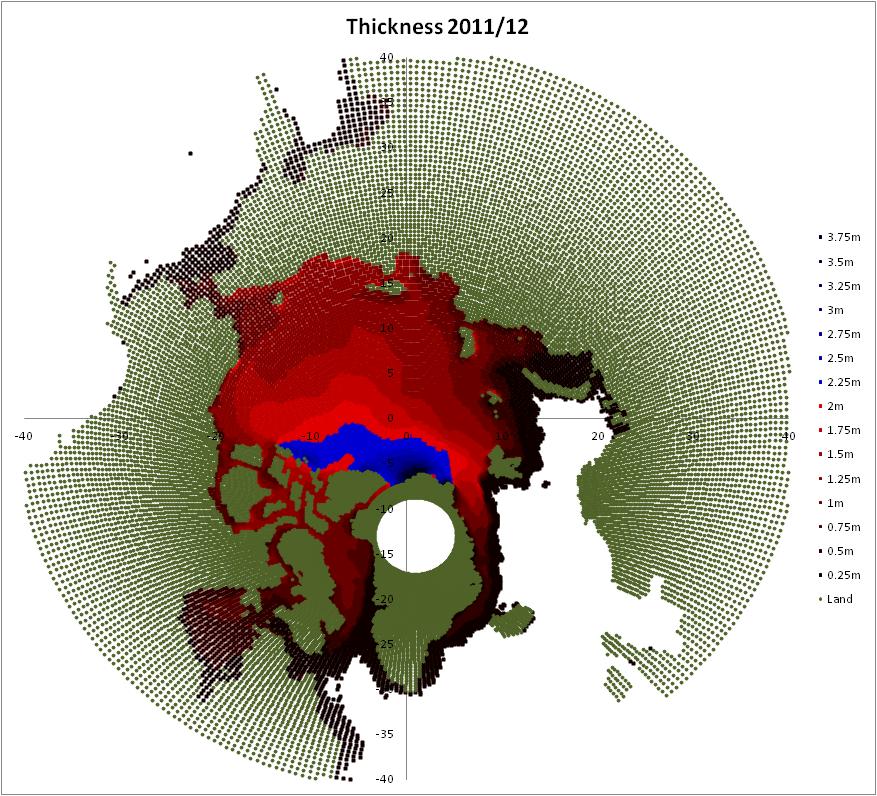
December 2012 is interesting. Close examination of those graphics shows no reported thickness over 2.75m, this is shown in the base data and such a deficit hasn't happened before. Here are the Decembers since 2006 - 2006, 2007, 2008, 2009, and the latest three shown below.
2010,

2011,
2012,
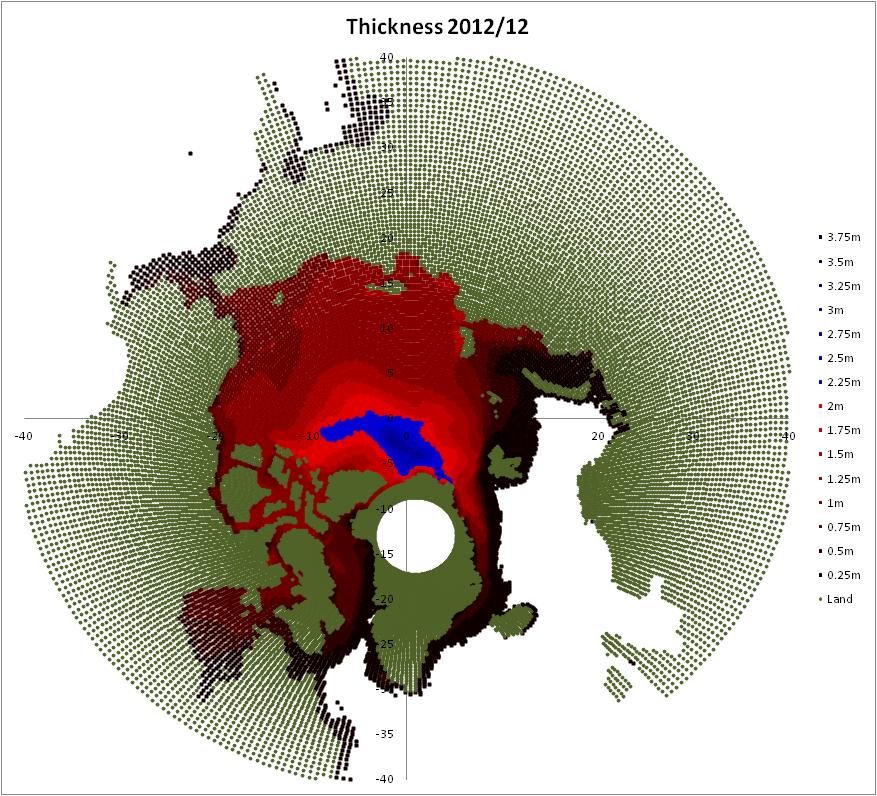
I wanted to show these because it's so thin right now, most of it around 1.25m. There is a lot of thickening to happen between now and early April, but that is starting from a low baseline and even though growth-thickness feedback should mean more thickening, that doesn't seem to have been helping things over the last few years, as can be seen from comparing the timeseries for September and earlier months, the volume loss over the summer is increasingly hitting thinner ice categories hard. This, along with other factors, mean I expect another exciting season.
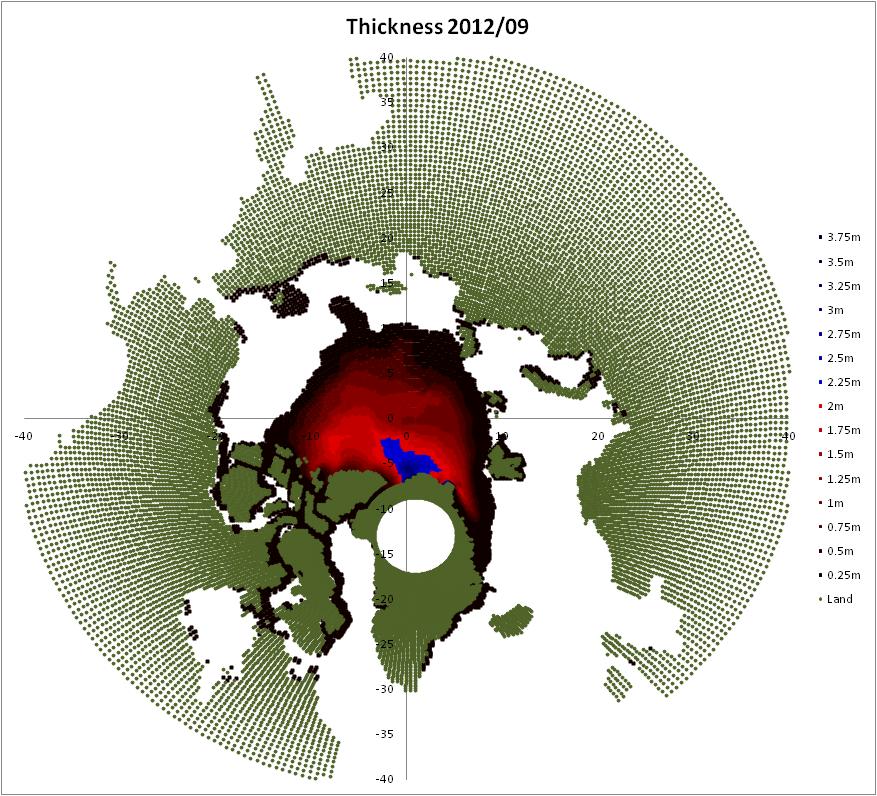
And the one people will probably want to see is September 2012. But before that, here's September 2002.
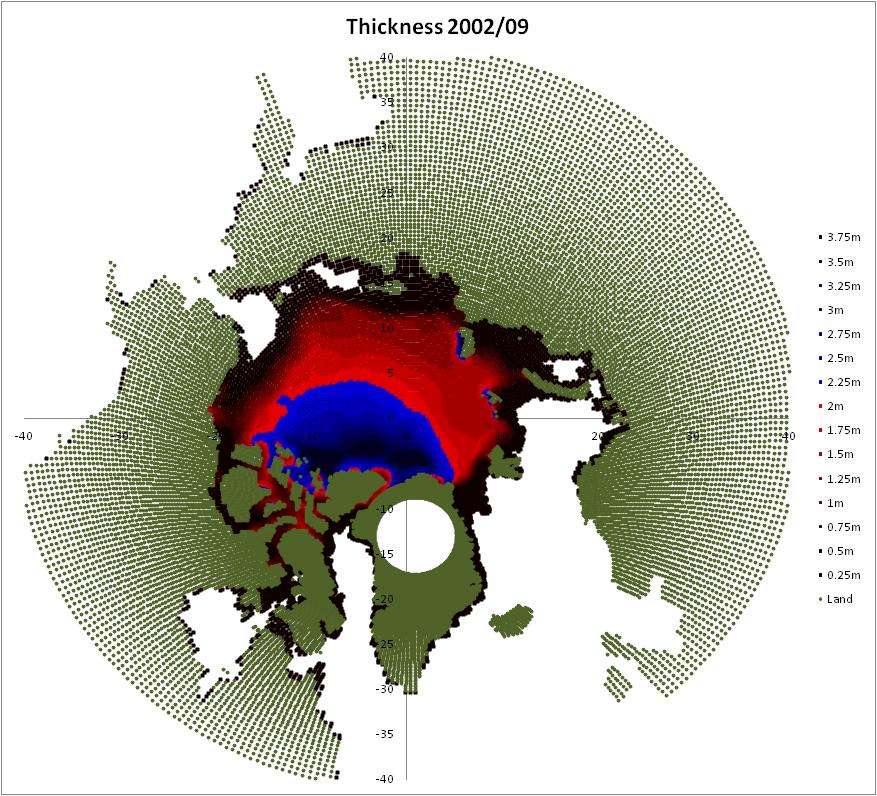
And in just 10 years...
4 comments:
These graphs show PIOMAS ice thickness (averaged or maximum?), the extent (15% ice) pictures for September had big chunks taken out of the last one!
I am sure 2013 will be "interesting" (frightening).
Mike,
They're average for the month.
How about exciting? We're privileged to be watching a geological scale event unfold within our lifetimes at a time when we have the technology to bring the information into the comfort of our own homes.
Typo. On the Piomass binning scale, 2.75 is repeated twice. The upper one should be 3.00.
Would there be any purpose served by auxillary charts where each bin is the same height (normalized to 100%)?
How about adding a predicted column for this year, as per some simple-minded trend?
Anon,
Thanks for spotting that. The data has been improved with more accurate volumes. You'll find the new dataset under the top right hand side panel - PIOMAS volume breakdown...
I've not applied a trend to each thickness band because there's a lot of useful detail in there. Given the current state of the ice I don't think prediction based on past behaviour is likely to produce sound results. For what it's worth, thickness over 2.75m is declining, under is generally increasing. But 2007 and 2010 produce various step changes dependent on month.
Post a Comment