This winter has been a record warm winter, not just a record, but as anomalous as a black swan skateboarding past you while criticising your fashion sense. The following images are from NCEP/NCAR reanalysis.


Such extreme warmth may be due to the current El Nino, however I struggle to account for it totally in terms of that factor. No previous El Nino has had such a staggering impact. Anyway the purpose of this post is PIOMAS, so having outlined some critical background let's look at the PIOMAS data.
All of the following is calculated from gridded binary files containing the PIOMAS data hefff and gice. Heff is the grid box effective thickness, gice is the distribution of thickness within each grid box. Both data types are explained here.
First I use the grid box effective thickness in overall volume calculations. Below is a plot of grid box effective thickness

Both Beaufort Sea and the Atlantic seas (Kara, Barents, Greenland Seas) are very thin, just how thin will be seen when I turn to gice data. Otherwise, 2m and above is what is more typical for 'healthy' sea ice.
Comparing the average thickness of sea ice in the various regions of the Arctic Ocean is done in the graphic below for recent years. Regions are based on Cryosphere Today regions.

Beaufort is exceptionally thin, Barents and Kara are thinner than in recent years, However along the Siberian coast, Chukchi, the East Siberian Sea (ESS) and Laptev Sea are not exceptionally thin, nor is the Central Arctic and the Canadian Arctic Archipelago (CAA). So how does this fit in the longer term context of sea ice thinning?
Below the same graphical approach is used, but for a set of long term past periods.

Due to the warming of the Atlantic Ocean the Kara and Barents Seas show a very strong decline in thickness. However the Greenland Sea does not, this is because the Greenland Sea is continually fed by ice exported out of the Arctic over winter, so it has resisted the declines of the other Atlantic Ocean influenced seas.
The Central Arctic has seen a massive long term decline in thickness due to the transition of the entire Arctic from a pack dominated by older ice to a predominantly first year ice pack. Indeed the overall decline in sea ice volume has come from this older thicker ice, not from first year ice (whose volume has grown). These considerations also apply to the CAA.
Along the Siberian coast the Chukchi, ESS and Laptev Seas are not exceptionally thin, indeed the ESS is rather thick compare to past decades. It is in Beaufort that we see a massive thinning this year compared to the past.
Calculating thickness for the whole of the Arctic Ocean (all the seas discussed above) gives the following plot. After an uptick in thickness in 2015 we are down to the same sort of thickness (~2m) seen from 2011 to 2014.

Zooming in now on the Beaufort Sea we can see that Beaufort is the thinnest since 1978. Thickness is calculated for grid boxes over 15cm thick so average thickness does not include open water or the model representation of highly dispersed floes.

Now to turn to volume, and the following few graphics are for volume calculated from grid box effective thickness.
This one is a bit spaghetti, but is a regular in my PIOMAS posts, note that the Central Arctic (Black) is shown on the right hand axis which is 4 times the scale of the left hand axis against which all other regions are plotted.

Perhaps easier and or more relevance is the plot of volume difference from April 2012, just before the previous record low September sea ice extent.

The pattern within the Arctic Ocean is of Beaufort having very low volume compared to 2012, whilst Chukchi to Kara are roughly the same or more this year, with the Atlantic ice edge being below volume in 2012.
Total volume for the Arctic Ocean shows a continuation of the pattern since 2011, the April volume loss from around 1990 seems to have stalled giving way to a more level regime at just over 19k km^3. I have previously argued that this is due to the thickness growth feedback and means that predictions of a rapid transition to a seasonally sea ice free state (e.g. 2015 +/- 3 years) are likely to be shown wrong by events. This year is confused by the extreme warmth of the winter and remnant increased volume in the Central Arctic, so I am not arguing this issue strongly based on this year, that noted, over the next few years I expect this pattern to persist.

Now for the graphics calculated from the PIOMAS gice sub grid thickness distribution, all of these are for day 121 of the year (30 April 2016). The timeseries graphs show different thicknesses in colours and should be self explanatory. But I'll just pop a graph up here to explain the thickness distribution graphs.

So the above graph is for the Canadian Arctic Archipelago, along the left side vertical axis is volume, and along the horizontal axis are various thicknesses. Take the 1.46m thickness, that's the central thickness of a band of thickness in the model (within a grid cell), for the entire sea ice cover of the Canadian Arctic Archipelago I have calculated the total volume of ice for that thickness in all grid cells in the Canadian Arctic Archipelago. That is typically about 400 to 500 cubic km (left hand volume scale). Likewise the thickness profile for all 12 thickness bands is calculated. Years are shown with a colour gradation, dark blue is older, light blue newer, but 2016 is shown in red to allow comparison.
So the Canadian Arctic Archipelago isn't exceptional in view of recent years. Let's go to the other extreme.
The collapse of Beaufort is seen as a total collapse in the gice data.

The timeseries is seen below and shows just how much the 2.61m and 1.46m thickness bands have been battered, this is the primary repository of first year ice volume.

Beaufort is FUBAR, the only ice that will be left in this region come September is what gets exported from the Central Arctic and the CAA into the Beaufort Sea.
Beaufort is about to show us what a normal summer will be like in the Peripheral Seas of the Arctic Ocean in the late 2020s.
Chukchi is looking OK, but it has a tendency to melt out in the summer, and this year as a neighbour to open water in Beaufort, it probably won't last.

The East Siberian Sea (ESS) is looking more healthy. The collapse in thick multi year ice is long gone, but the first year volume is fine.

Indeed, the timeseries shows it is one of the higher volumes of this century. That noted, I suspect we will see large August losses if we have a strong appearance of the Arctic Dipole.

Laptev could be stronger, but is far from the lowest on record. There is a reasonable expectation of a virtual ice free state by September.

You could say Kara has collapsed.

But if you did you'd have to say Barents just couldn't be bothered getting up from the start.

Only 2006 showed a poorer state in Barents.

Barents shows us what a normal summer will be like in the Peripheral Seas of the Arctic Ocean in the late 2030s (that's a long shot guess but I doubt it will take much longer).
Reviewing a gice thickness distribution like Beaufort or ESS above and it can be seen that the thicker ice has collapsed, and as it has freed up area that has been taken over by first year ice. So the first year ice (~2m thick) volume has built up as the thicker ice has collapsed.

In the Greenland Sea this process can be seen, where the thicker ice exported into this region from the Central Arctic has thinned and been replaced by thinner first year ice. This year the volume of exported first year ice has collapsed, either because less has been exported, or because or warmth in the North Atlantic.
The Central Arctic is in a similar state to many recent years. For a record low below that of 2012 there would need to be serious inroads into the Central Arctic, it seems to me that this totally depends on the weather. Little about PIOMAS ice state suggests ice condition guarantees it.


I'll close this rather long post by giving my Sea Ice Prediction Network prediction for 2016, this is based on April PIOMAS volume for the Arctic Ocean. Here are the hindcasts and forecast, hindcasts are 80% successful.
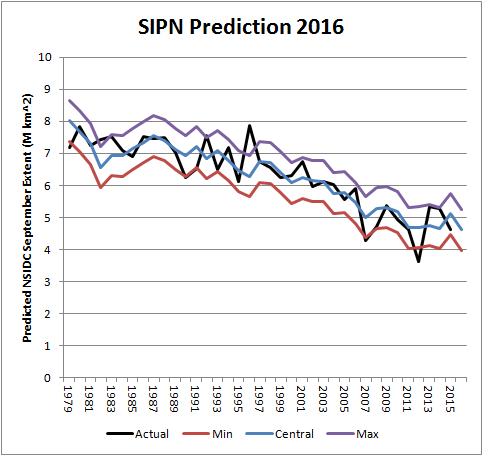
Numerically the range is 4.0 to 5.3 million kmsq. The record low was in 2012 with a September extent of 3.62 million kmsq.
UPDATE - the PIOMAS Gice data for this post is now available in an Excel spreadsheet, here.
11 comments:
Chris,
Is it possible for you to provide the graphs you presented in previous years which showed the volume of ice at various thicknesses across the arctic.
For comparison purposes these are useful, and by limiting data to the past few years they are easier to read.
The graphs shown clearly suggest a dramatic season. If we have to endure it we should learn what we can from it. Combinined with the remarkable heat over the last six months the low thickness offers little hope for avoiding a record low.
David,
I assume you want this for your SIPN prediction?
Here is Gice as a csv file.
https://drive.google.com/file/d/0B3pB-kdzoLU3a2pkTmlDbzgwbk0/view?usp=sharing
Day 121, Arctic Ocean.
In previous years I may have used a calculation based on grid box effective thickness. I've discontinued this in favour of gice but can recalculate if you need it.
Chris, did you make a prediction? I'm going with 4.1 km2. I'm a bit skeptical about a record low just yet.
Dreessen,
It's at the end of the post, 4.0 to 5.3 million kmsq. If there is strong Arctic Dipole activity early in the summer the minimum will probably be below that.
Thanks Chris, I had a look at the gice data but it can't be translated back into the grid box effective data which is the basis of my estimate.
If you can recalculate it I would appreciate it. Particularly if you can give me a link to a summary. Id prefer to have the actually summary numbers rather than a graph. But im only interested in the Arctic wide data.since 2010 if that makes it easier.
ie:
Thickness (10cm) (20cm) (30cm) ...
2010 (Vol) (vol) (vol) ...
2011 (Vol) (vol) (vol) ...
...
2016 (Vol) (vol) (vol) ...
Great if you can provide it.
Hi David,
I may not get the chance tonight, looks like I'll be here at work until after 7. But I will do so either tonight or tomorrow night.
Chris
If there's any evidence as to why I think some people on the sea ice blog are misguided, this would be it: http://neven1.typepad.com/blog/2016/05/beaufort-under-relentless-high-pressure.html#comments
David,
Hopefully this link will work.
https://drive.google.com/file/d/0B3pB-kdzoLU3bzlyYmNBS3FZSW8/view?usp=sharing
Dreessen,
Why not sit back and let events adjudicate.
Chris ,
Thanks for the second file. I've done some preliminary work on my predictions for the year, using the IJIS data, and nothing looks good.
My assessment suggests extent will stay at record low levels until at least mid July. By that time I expect the effect of insolation on the additional open water will be having a profound effect.
In the short term we should see strong melt for the rest of the month with a sub 10M km^2 June 1st a distinct possibility.
The last graph shows potential long term effect after 2007. Granted there are only a few years of data after it but either we're talking about the serious business of soothsaying or we aren't....
I wonder if the April thickness maps show the same feature of yellow dividing the thick muti year sea ice at the back of the CAA/Greenland as it does for 2011 and 2012?
I might check 1998 aswell as everyone says it did give us long term problems with the days of ol' gone forever.
Post a Comment