A large tract of open water has formed in the Beaufort Sea (NASA MODIS), in this false colour image it can be seen as a darkening in the orange of the sea ice under the white of the cloud.

This has been driven by strong winds away from Banks Island and towards Chukchi (NCEP/NCAR).

So how do AMSR2 and NSIDC Extent compare? The following graph is for data for the whole Arctic, NSIDC extent subtracted from AMSR2 extent.

The difference varies with time through the year with a seasonal cycle, so it might be possible to work around this using an offset table for each region, but I'm not happy doing that with only three years of overlap and lacking extreme years like 2007 or 2012. What is notable is the large negative excursion recently due to the NSIDC sea ice concentration sensor problem, NSIDC extent increases by 0.8M km^2 on 7 and 10 April above the levels preceding, this shows the danger of using that data. NSIDC state that the sensor problem was first noticed on 5 April 2016.
So the above noted, below I show Beaufort extent for NSIDC extent (Wipneus' calculation based on NSIDC concentration), this is shown together with AMSR2 for 2016.
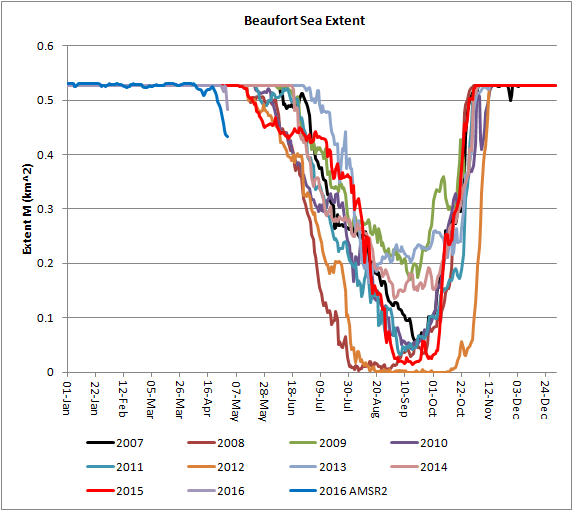
The fall in extent this year is early, exactly how early is not clear due to the difference in timing between NSIDC extent (2016 light purple) and AMSR2 (2016 blue). However it is reasonable to presume it is probably the earliest drop in extent that starts the summer drop.
This drop in extent may not continue, for a start it is wind driven, furthermore as the melt begins in earnest there is a tongue of multi year ice visible in images from the ASCAT satellite. ASCAT shows thicker multi year ice as brighter than first year ice, and multi year ice tends to be more resistant to melt than first year ice. As extent only needs a concentration above 15% sea ice cover a relatively small amount of ice resisting melt can keep extent up.

The significance of this early open water in Beaufort lies in the ice albedo feedback. Basically because ice is white it reflects most of the sunlight away from the surface, when the ice melts to reveal darker ocean it increases absorption of sunlight which warms the ocean and melts more ice. So a tract of open ocean at the start of the season can give the melt a kick start, especially as the sunlight reaches its strongest in late June.
As of March PIOMAS modelled volume was at the lowest on record by some margin.

And the ice that was there was the thinnest on record.

This should make it easier for the ice albedo feedback to work on what ice is there.
In my previous post I showed a series of close ups of Beaufort ice thickness as measured by the Cryosat 2 satellite. According to both PIOMAS and Cryosat 2 the ice in Beaufort is the thinnest on record.

So the sea ice in Beaufort has entered the melt season very thin indeed and it faces a possible early kick start to the ice albedo feedback. This may have implications for other regions.
In a quick filler post just before I posted this I updated the situation regards the August Extent Loss Oscillation, I should have done that last year but was distracted by other interests. Now it is updated and last August's losses suggest a continuation of what seems to be a four year cycle in August NSIDC extent losses.
Most years since 2007 have seen summer dominated by the Arctic Dipole atmospheric pattern, the average vector wind from NCEP/NCAR for early summer (June & July) is shown below.

With such early open water in Beaufort, which the ice albedo feedback should act to increase, any pool of warm surface water subject to those winds could end up attacking Chukchi and the then East Siberian Seas. Due to Ekman Transport the movement of a surface pool of warm water should be at 20 to 40deg to the right of the above wind directions. This movement of warm water from Beaufort might prove to be significant because in other Augusts during the supposed four year cycle peak of August extent loss the regions Chukchi and East Siberian Sea (ESS), losses for the ESS are abnormally high, this is mainly due to the ESS.

So the impact of the early start in Beaufort could have wider impact than just that region.
I shall have more to say about the prospects for the coming melt season, as I see them, once PIOMAS data is released. However if thin ice due to the abnormally warm winter is to be the key player this year, we will know by the end of June.
4 comments:
Thanks for this, Chris. I've put in a link in the comment section of my latest blog post: Beaufort under relentless (high) pressure
Neven,
I think we're both going to be very busy until September!
Good jump on what looks to be one of the hot topics of this melt season. Adding to the ice albedo feedback will be rapidly rising temperatures this coming week and, soon after, an early surge of meltwater from the Mackenzie River.
I recall you had a post last year that anticipated and discussed the effects of low MYI in the Beaufort during 2016. Considering that MYI must have rotated into the Beaufort on the recently strong gyre, it's remarkable that effective thickness is at a record low.
Iceman,
I must admit that I'm not firm on why Beaufort is so low, however the following are differences from the 2007 to 2015 average from Jan 2015 to April 2016.
0.019 Jan 2015
0.076
0.051
-0.066
-0.183
-0.087
0.033
-0.001
-0.038
-0.028
0.012
0.008
-0.039 Jan 2016
-0.160
-0.239
-0.330
The deviation starts from February of this year and compounds with each successive month. Basically it's wind and temperature, but I'm not sure of the relative roles.
Post a Comment