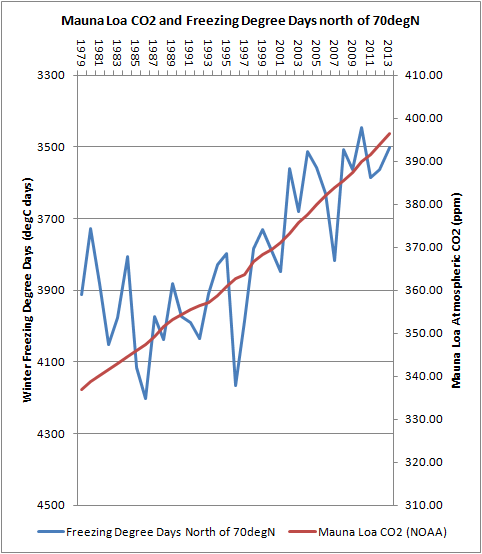
Freezing Degree Days (FDDs) is a measure of winter coldness, it is the sum of daily temperatures below zero degrees C over the winter. As explained previously, for my calculations I have used the area weighted average of grid box FDD north of 70degN, where due to an interest in sea ice I have used -1.8degC as the demarcation to below zero (-1.8degC being the approximate freezing point of sea water). i.e. a day counts towards the FDD calculation if a grid box has a daily temperature of less than -1.8degC.
In the blog post concerned I finished with the following graph.
The observant reader might notice that this graph is slightly different from that previously posted. The reason for that is simply that previously I used some unattributed CO2 data from one of my spreadsheets, however this data is from the NOAA Mauna Loa CO2 record.
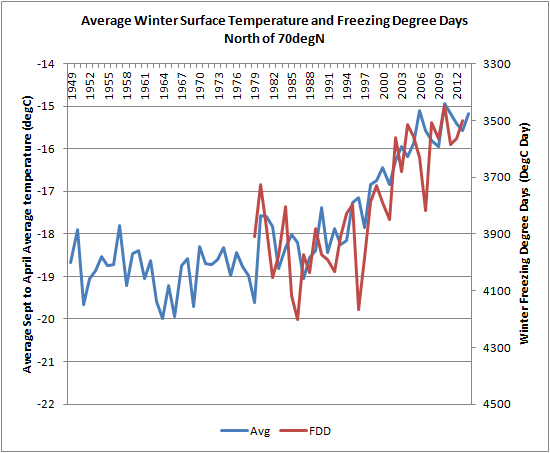
The clue that all may not be what it seems is at the start of the graph, where there is poor agreement between FDDs and CO2. Comparing FDDs and winter average temperature north of 70degN (source) shows what is going on.
The agreement between FDDs and the average NCEP/NCAR temperature is good where the series overlap, and it is reasonable to presume that the FDDs would show a level profile before the late 1980s, this demolishes any suggestion of simple driving role for CO2.
In my comments about the graph of CO2 and FDDs I cautioned:
Because ice loss is warming the atmosphere in autumn/winter the relationship there might not be as straightforward as CO2 alone causing the decrease in FDDs, sea ice loss itself may play an amplifying role.I have previously blogged on the connection between winter warming and sea ice loss, finding that in the region considered (Off Siberia, 70degN to the pole and 90degE to 190degE) thinning of sea ice is warming the atmosphere. I suspect that this is what is going on here.
I've been criticised for the following trick, but I find it useful to identify when an upwards or downwards trend starts. I'm going to use the cumulative sum of interannual differences, which has been correctly pointed out as being a differentiation followed by an integration. However for a function ax + b, this removes the 'b' part and in returning the ax part shows where the deviation from zero begins. In simpler terms, where there is no trend the interannual differences sum to zero and the plot tracks along as moving a bit above and below the value of zero, as soon as a continuous trend starts the plot starts to clearly deviate from zero, either up or down.
So it can be seen that the cumulative sum of interannual differences wiggles around zero until the late 1980s where gradually it starts to rise before starting a strong deviation from zero in a consistently positive direction.
I consider that the 1980s upward deviation is like the downward deviation of the 1960s, and that it is actually only from the early 1990s that the strong warming trend begins. Note that this is a roughly 3 degree warming in about 2 decades, or 1.5degC/decade warming, that is stunning for a region as large as that north of 70degN. This massive warming will be apparent in a later plot of northern hemisphere temperature change.
The early 1990s is significant because Lindsay and Zhang find that the volume loss in the PIOMAS model is due to a self acceleration process due to the ice albedo feedback, and that this process started in the mid 1990s. This has previously been covered in this blog post, from which the following graphic is taken.
So the sea ice volume begun to decline during the trigger phase, in which the Arctic Oscillation and Pacific Decadal Oscillation started the decline of sea ice, and the volume loss intensified thereafter during the feedback phase due to the ice albedo feedback. And it seems to me that as this process was underway winter surface temperatures started to climb north of 70degN.
With the NCEP/NCAR Monthly/Seasonal Composites page I have used a baseline period of 1951 to 1980, which is the NASA GISS baseline and is in the period of no warming trend in the surface temperature data shown above. This baseline is subtracted from the average temperature from 1990 to 2013 to match the above calculations and reveal the vertical structure associated with surface warming shown above.
The warming is shown to be a very surface limited feature, with warming aloft being below 1 degC, while the warming at the surface is around 3degC. This is likely to be in part due to the reduction of the surface temperature inversion that is common to the Arctic Ocean over the ice pack, however increased heat flux through thinning ice likely plays a role. A surface temperature inversion is where temperatures increase with height due to the presence of cold air at the surface, normally as one rises through the atmosphere temperatures decrease.
Such a reduced temperature inversion could be caused by changes in wind. The scalar wind index of the NCEP/NCAR dataset shows wind speed regardless of direction, I have processed it in a similar manner to temperature above for the region north of 70degN. This plot shows the difference in wind speeds for September to April between 1990 to 2013 and 1951 to 1980.
Wind speed has increased, but only by up to 1m per second, or 2.2mph, not a significant change. I'm not an expert on this but such breezes are not what I would expect would substantially disrupt an inversion.
However the thinning of sea ice would be expected to increase heat flux into the atmosphere, particularly in the early autumn. That would disrupt a temperature inversion. Comparing cross sections for September to December and January to April shows the surface warming is stronger in the autumn than later in the winter (not shown). And the autumn surface warming is clearly strongest over the ocean in the regions where ice recession has been greatest, as seen below.
So it seems to me that the winter warming is due to the loss of sea ice, not CO2 increases. The linkage to CO2 increases is indirect as the sea ice loss is enabled by increasing CO2, as shown in the end of my blog post on the cause of the PIOMAS volume loss.
What strikes me as important here is that this winter warming due to sea ice thinning constitutes a positive feedback. Sea ice thinning warms the surface air temperature in the winter and this thins winter ice growth which further enables ice loss in the summer due to the ice albedo feedback. However positive feedback does not necessarily imply a rapid transition of the sea ice to a seasonally sea ice free state in the summer. First it is important to note that since about 2007 the rapid winter warming of the region north of 70degN seems to have abated (second and third graphs of this post). Secondly it is important to note that the relationship between FDDs and winter sea ice growth is almost linear down to around an FDD of 2000, with current FDDs of around 3500 having declined only around 500 during the period of rapid warming since around 1990, which corresponds to only around 20cm of thinning in the thermodynamic growth of ice over winter.


4 comments:
The thing that puzzles me is that when one eyeballs something like the Cryosphere Today grph showing every year since 1979 it doesnt look like either the freezing season is ending earlier or the melt season is going on later. Maybe this is not the case when the data es checked properly?
Any thoughts
Pete
Anon - remember that the arctic is still largely driven by the seasonal cycle. The insolation changes from periods of almost constant sun to almost no sun are pretty drastic.
In the winter average temps over the arctic ocean are -30C. Even a relatively large increase in winter temps is not going to change the fact that ice is going to form.
That said, yes, the numbers show the melt season coming earlier and the melt season lasting longer, but these changes are not large enough to really be visible just eyeballing graphs.
Pete,
Sorry for not replying earlier. I agree with Kevin.
In the autumn venting of heat has led to later refreezes, however this may be only strongly visible in regional data.
In contrast, as Kevin points out, the start of the melt season doesn't seem to be getting earlier as fast because it is relatively fixed by the rising of the sun. And in future I expect that this pattern of autumn late freeze getting earler and little change in march/april melt to be continued.
A lot of the decline in fdd seems to be because the autumn and winter are warming. In preparing this post I did a graph that may show that.
I've got regional data and will try to get the time to go into more detail for you and other readers this week.
Pete,
Just in case you catch this reply. A blog post (at least one) on season length will follow in the coming week. It's taken me a while to decide how to tackle the issue, and I think I've settled on a method.
Post a Comment