I've previously posted about a suspicion that as the ice nears 2m thick it may rapidly crash to near ice free late summer conditions due to a non linear nature between April thickness and the percentage of open water formed by September. PIOMAS April thickness shows a shift around 2m from low percentage of open water formation to high open water formation.
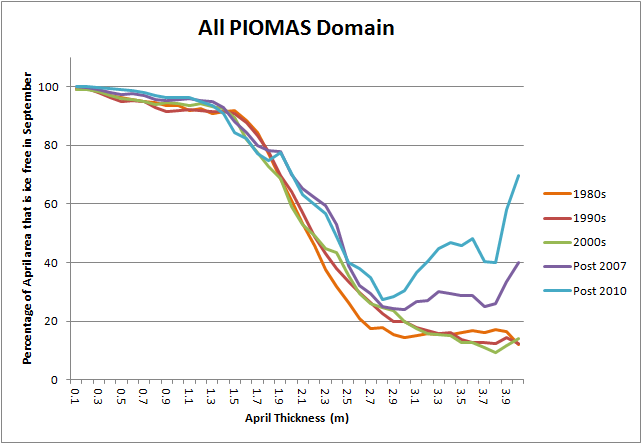
This is similar to panel B of Lenton 2012 "Arctic Climate Tipping Points", PDF, where translating the above graph to that graph, the control variable would be April thickness and the system feature would be the percentage of open water formed in September. Note that the horizontal axis is also reversed.
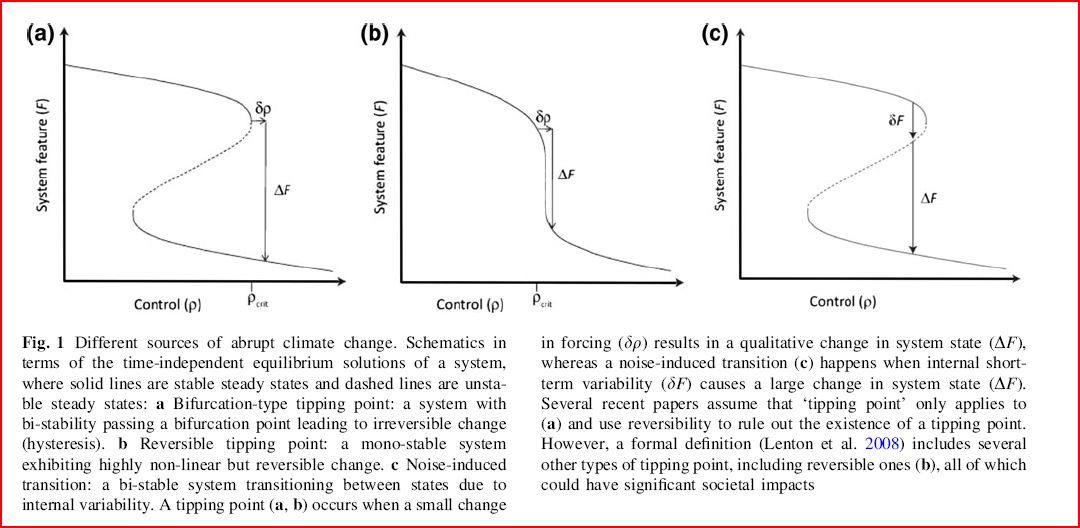
This would represent a reversible type tipping point. However I have blogged recently about a factor that may stop thickness from dropping further, the transition of the pack to a mainly first year ice pack. That is the thickening of ice over winter.
Since 2000 April average area for the Arctic ocean has been around 9.65M km^2 - i.e. this is the nominal area of ice covered ocean at the volume peak. Assume a nominal 2m equilibrium thickness for the FYI, also assume that thinner ice at the Atlantic edge is to some degree offset by the thicker ice in the Central Arctic. 2m * 9.65M km^2 => 0.002km * 9650km^2 = 19.3k km^3. So an April peak volume of around 19.3k km^3 is the nominal volume associated with an Arctic Sea ice nominal thickness of around 2m.
Now, keeping in mind 19.3km^3, look at what has happened to April Arctic Ocean volume, volumes in thousand cubic km (km^3). Instead of a graph I've copied the following from an Excel spreadsheet, to stress the numbers at the end of the series, and graphically show the decline.
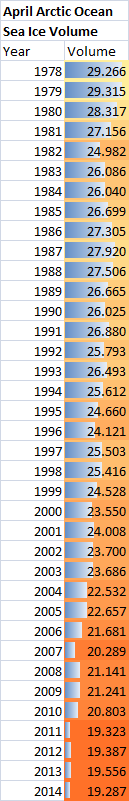
Since the volume loss of 2010 the volume of the Arctic Ocean has levelled at around 19.3k km^3, the same volume as calculated to be the rough volume to be expected with a mainly first year ice pack. I do not think this is coincidental.
All this means I expect to see an end to the previous volume loss trend because this was mainly due to loss of multi year ice (MYI). MYI is now going to fluctuate at low levels in the years to come. Volume and MYI may be up at the end of this season, but it remains fluctuation at a low level compared to the past. By next April I expect to see a volume figure similar to the last four volumes of the series shown above. The end to the period of rapid loss of volume may already have happened, but the time period involved since 2010 is far to short given the variability in the data for statistical significance.
Therefore with regards summer area, extent and volume, I think the spread from 2007 to 2013 is probably typical of what we will see for at least the rest of this decade, with 2012 type drops being followed by a reversion to that range, not a new regime (unlike 2007). I still suspect 2010 may have a lingering effect, but this year suggests it may not be as strong as the post 2007 period. Critical to all this is that I am becoming convinced that the approximate levelling of PIOMAS volume over the last few winters is telling us that the pack is becoming dominated by FYI, whose thermodynamic equilibrium thickness is largely setting the peak volume in April. Even if one year, with exceptionally good melt weather, were to lead to extent below 1 million kmsq, this will be unlikely to be repeated, and for the record, I do not think this is likely anyway. To get to a state of near ice free conditions in late summer we will need to see significant thinning of the winter peak thickness, which needs far greater winter warming. I don't think this is likely to be a fast process.
So I do not expect to see a virtually sea ice free state until later in the next decade - at the earliest, I suspect that Overland and Wang may be proven right in pinning it on the 2030s. In terms of expectations amongst many in the amateur sea ice community this is a slow transition. However in geological terms it remains abrupt.
Appendix for Dromicosuchus, who asked if the process of April ice thickness loss levelling is happening in any of the peripheral seas.


27 comments:
Given generally warmer winters, mightn't the quality of the first-year ice prove to be a factor in the process of transition to ice-free summers? It seems possible that winter freezes would produce ice that is less resistant to early melt, particularly if (when) the melting season grows longer.
I have been following your blog for some time, and I've always looked forward to your analyses on the Arctic Forum. Since you've obviously spent a lot more time and energy studying this than I have, your thoughts carry a lot of weight, but I wonder if there may not be many more factors in this whole process than any of us have been able to grasp.
Hi NotJonathon,
Neil has raised almost the same point over at the forum. See Here
Basically ice growth is most vigorous early in the season, so for conceivable shortening over the season thickening should not be as massively affected as it might seem. Winter warming is a factor. However most of the winter warming is from the surface and seems to be due to loss of ice, rather than causing loss of ice. A rough estimate from PIOMAS suggests that thinning from ice 1 to 2m thick is of the order of 1.5cm per year. That doesn't massively affect my conclusion.
Yes, there may be something I'm wrong on, and we may be in for a fast crash. But I don't think I'm wrong on this.
Chris, you're usually more conservative about jumping to conclusions than this.
I think it's premature to conclude that nearly ice free summers are that far away. For one, we're seeing the consequences of two very cold Junes (and resulting delays in snow melt), back to back, leading to two subdued PIOMAS spring volume anomaly drops. But given the *very cold* Junes surely it is remarkable that the spring volume drops of 2013 and 2014 are STILL larger than ANY pre-2010 year? And don't we have every reason to believe that in a few years, most years will have a spring PIOMAS volume anomaly drop signifcantly larger than any that we've seen so far?
Second, the winter ice thickness growth is strongly dependent on how cold the winters get. It seems plausible to me that warming winters could serve to reduce the amount of thermodynamic growth of FYI to its spring thickness maximum by quite a bit more than your extrapolation suggests (say, by 25 or 30 cm/decade). Of course it also seems plausible that this won't happen, but even without that if the spring volume anomaly drops get to 6 or 7 k km^3 (which I think is plausible perhaps at this decade's end but certainly by the mid-2020s) we'd still have nearly ice free summers.
If we reach a point where there's still open water in the Arctic Ocean proper on December 15 or so, the winter will be crazy warm until at least January 1. By that point, half the freezing season would have already been lost.
Nightvid,
Yes, we're still clearly in the post 2010 era, despite weather the spring volume loss has still happened in PIOMAS - it is not just warm weather in spring of 2010 to 2012. The 2007 volume loss event and 2010 have led to a change in the seasonal cycle.
Why would the spring volume anomalies fall further? When PIOMAS ice is artificially thinned by 1m at the start of the melt season the result is a super aggressive spring melt resulting in only the thickest ice off the CAA surviving into the late summer. Both 2007 and 2010 led to massive loss of volume and hence thickness. If volume/thickness is limited to around 19.3k km^3 within the Arctic Ocean by winter thermodynamic growth, then where does the further thinning come from in a further large volume loss? There is nowhere for it to come from because after a 2012 type event you'll see volume jump back up to the 19.3k level (ballpark) due to the thickness/growth feedback. Is this why there is no evidence in the PIOMAS data of a post 2012 effect?Unlike 2007 and 2010.
Yes winter warming will increase and will lead to thinning of thermodynamic growth. But by how much? The warming over the pack in winter so far has been of the order of +5degC over the last 20 years. Lets say that over the next 20 years there is a warming of another 5degC - There may not be, there is a limit to how much heat the ocean vents unless the melt season produces much earlier open water. This takes winter (Oct - March) temperatures from about -23 to -18degC on average (N of 80degN). Given the strong rate of ice growth and thickening in recent years in the early part of the freeze season when average temperature is around -19degC, I'm not sure we can expect winter thickness (volume) to reduce to such a degree that reasonably expected rates of summer melt can remove virtually all the ice.
It is worth pointing out that thinner ice, while warming the lower atmosphere also vents a lot of heat. This acts to put the breaks on net energy gains of the ice/ocean system.
I don't expect a serious roll back of open water into the early winter until we see very early open water in the melt season such that there is a massive amount of energy in the ocean to be lost before melt can start. I'd expect this after we start to see regular late summer extents of less than 1M km^2.
Chris,
Isn't it only logical that a continued increase in the average temperatures for spring and summer months will lead to even earlier snow melt across the Arctic, with the ensuing albedo loss causing more aggressive melting?
It seems right now that the date of snow loss correlates with how much thinning will occur over the season. Areas that lose snow before June 20th seem to have the ability to thin by 2.5 meters during that season, while areas keeping snow up to July 1 lose <2m typically. If snow cover is still there by July 15, it's unlikely the ice will lose more than about 1 m that summer.
So it seems plausible to expect continually more aggressive spring melts as the snow cover gets lost sooner.
And as to the increased winter heat flux, yes, the negative feedback dominates over the effect of warming atmosphere, however, warming atmosphere reduces the magnitude of that negative feedback.
And as far as lingering open water in the fall, it seems we got a glimpse of this in 2007 when the Chukchi Sea didn't freeze over totally until mid-December. So why is lingering open water in, say, the Laptev Sea, until mid-December so unreasonable to posit will happen in the mid-2020s?
Interesting as usual, Chris.
I wonder, if what you say is correct, what will happen to the thing that has caused all the volume loss up till now? If it's heat, where will it go? Added to this:
"It is worth pointing out that thinner ice, while warming the lower atmosphere also vents a lot of heat."
And what will all of this mean for the consequences of sea ice loss, atmospheric patterns in particular?
Nightvid,
It is not unreasonable that we will see later open water in the mid 2020s. But I don't think we'll see the really late open water until there is much earlier melt and greater open ocean early in the season to absorb sunlight for longer periods.
I disagree that we will see continuing increased losses in summer to such a degree that they will offset the slackening of winter volume loss that I think is happening.
To repost something from the forum:
QUOTE
However all of that relies on continually increasing melt season losses. This is not guaranteed, nor is it likely in my opinion. A large element of the increased losses is not due to a long term increase in volume loss during the melt season, but is due to step jumps after 2007 and 2010, both years of large volume loss.
Using PIOMAS volume for the Arctic Ocean. The linear fit to 1978 to 2006 volume loss from Aprilm to September has a slope 0.036 (+/-0.21)km^3/yr, so it suggests the trend is postive, i.e. over that period there has been an increase in melt season losses. However the y axis intercept is 11.88k km^3 (where the trend line starts), by 2006 the trend line is at 12.94k km^3. Taking the recent periods and averages of summer losses:
Period_______ Average summer loss
1978 to 1982, 12.54
2003 to 2006, 13.01
2007 to 2009, 14.02
2010 to 2013, 15.16
So while there has been a gradual increase of summer loss over the period 1989 to 2006, the (admitedly short) periods thereafter show step increases of summer loss. I've singled out 2007 and 2010 because they were years of substantial volume loss. This volume loss has led to a thinning of the ice which has aided more rapid melt in the melt season.
Critical is understanding what is leading to the increased loss of volume during melt seasons. It is increased amounts of ice in thinner categories leading to greater open water formation and greater ice albedo feedback. If thickness merely tends to a nominal 2m in April then further gains through April thinning will not happen. The process will instead be more gradual.
Therefore I doubt that seasonal losses will continue to increase as they have done in recent years.
/QUOTE
http://forum.arctic-sea-ice.net/index.php/topic,778.msg32164.html#msg32164
Neven,
That all comes down to the argument presented in Bitz & Roe's Mechanism for the high rate of thinning in the Arctic Ocean.
Multi year ice has a long lifetime, it sticks around for years (it has to in order to become multi-year ice). So it is able to 'integrate' impacts upon it, in an environment favouring ice loss this leads to MYI decline.
First year ice regrows vigorously the next year, if it survives a year it becomes MYI. Having such a short lifetime it has no 'memory' of impacts years previously. So in an environment favouring ice loss multi year ice does not suffer as much loss as MYI.
I was persuaded that the loss of MYI represented energy that would then have to go into melting FYI after the MYI had declined. However because FYI regrows in the winter it vents this notional energy. The energy that once went into melting MYI is thus vented into the atmosphere and radiated to space in autumn/winter.
Neven,
Sorry, forgot to address your point about the atmosphere - we don't need an ice free Arctic to see the atmospheric impacts, I think they're already happening. A longer transition will however mean more years to analyse the atmospheric impacts during the end of the transition to a seasonally sea ice free state.
Dromicosuchus,
Good idea, it hadn't occurred to me to check.
Yes there is evidence of levelling, but not everywhere, I will post plots tomorrow - too late now I have work tomorrow.
Arctic Ocean thickness (metres) from 1978 to 2014 for April.
1978 2.739
1979 2.761
1980 2.821
1981 2.589
1982 2.382
1983 2.584
1984 2.600
1985 2.600
1986 2.643
1987 2.687
1988 2.581
1989 2.614
1990 2.589
1991 2.677
1992 2.572
1993 2.644
1994 2.569
1995 2.496
1996 2.389
1997 2.456
1998 2.432
1999 2.390
2000 2.341
2001 2.310
2002 2.332
2003 2.317
2004 2.233
2005 2.258
2006 2.205
2007 2.064
2008 2.115
2009 2.092
2010 2.045
2011 1.935
2012 1.965
2013 1.934
2014 1.938
As you will see the average is held up by certain regions such as the Central Arctic.
You seem to be saying there's a limit to how much heat the ocean vents in the winter, and that it's enough to vent the heat picked up from sunshine on open water so that the amount of open water won't increase.
There are two sources of heat that can continue to increase: warm ocean currents, and warm river water. Are these two sources of heat insignificant compared to sunshine on open water?
Cesium,
No, I am saying that the bulk of the decline of volume has come from loss of multi-year ice, and that now the pack is mainly first year ice its winter peak volume is becoming defined by how thick the winter ice grows.
Warm ocean currents and warmer rivers can affect peak ice thickness. The question is; how fast can we reasonably expect winter ice to thin? And will such thinning be enough to make winter volume equal to the volume loss in the melt season resulting in virtually no ice at the end of the melt season.
Very many thanks for the extra graphs, Chris (Mr. Reynolds? Do you have a preference?)!
Anyway...Well. That is interesting, particularly the Kara. I tried rescaling the assorted graphs and sticking them all together, to see if there was any clustering around ~2 m, and the CAA, Beaufort, Chukchi, Laptev, and ESS (I was wrong about that that last showing a further downward trend, I think, now that I've got others to compare it with) do indeed seem to cluster at around two meters. I wonder why the Kara defies the behavior of all the others, starting out a ~2 m and then very markedly and noticeably declining? There isn't really anything else like it, which leads me to suspect that there's some local effect going on there that doesn't operate elsewhere in the Arctic.
Maybe the focus should be the Barents? This is where we observed a gradually thinning ice since the 1960's, when the USA military was gathering their data set for sub war motives.
I noticed the Barents ice loss is significant, and this may also mean you will require inclusion of the fresh water flows in your analysis? I'm basing my comment on the thesis that we should see a thicker snow pack in Arkhangelsk Oblast and Siberia. Question: are you monitoring the river flows in the Pechora, Ob, etc? Those rivers ought to carry a lot of warmer muddier water in the future.
>"Kara defies the behavior"
Warm Atlantic water now reaching Kara? The ice edge in Barents has moved north much faster here than in other directions. So instead of Atlantic water being cooled as it passes Barents ice it now reaches Kara?
On the other side Chukchi is only just getting down to 2m. Will it continue downward with warmer Pacific water? That seems to be one to watch.
I presume Atlantic water is also reaching Laptev to cause the thinning. I cannot imagine that PIOMAS has got increased methane releases built in to cause such thinning.
Dromicosuchus,
Just 'Chris' is fine.
The way I read those graphs is that the warming of the Atlantic (have there also been current changes?) has thinned Barents, Kara, (and Laptev?). Barents is the most striking thinning, but Barents extent in winter has been declining massively throughout the 20th Century, probably due to Atlantic warming, and this is an ongoing process.
Sticking with the Atlantic, the Greenland sea hasn't changed. It's an area of strong export and melt so behaves differently from the rest of the pack.
Chukchi - noisy - might decline further with Pacific Water inflows, as suggested by Crandles.
But Beaufort, ESS, CAA and Central, all could be interpreted as the start of a levelling.
If people want regional thickness from PIOMAS just Google 'dosbat regional piomas' - you should find my main data page is the top page.
I'll try posting thickness numbers for the above in the next comment.
April PIOMAS sea ice thickness by region.
Year,Beaufort,Chukchi,ESS,Laptev,Kara,Barents,Greenland,Central,CAA
1978,2.594,2.967,3.153,2.429,1.977,1.255,0.947,3.537,3.028
1979,2.610,2.905,3.535,2.720,2.153,1.307,0.912,3.379,3.205
1980,2.565,3.145,4.083,2.258,1.909,1.078,1.084,3.301,3.166
1981,2.322,3.154,3.353,1.935,2.097,1.275,1.026,3.147,2.775
1982,2.252,2.334,2.740,1.863,2.061,1.344,0.980,2.991,2.287
1983,2.471,3.065,3.122,1.984,1.878,0.968,0.815,3.215,2.519
1984,2.645,2.988,2.972,1.799,1.769,1.102,0.981,3.244,2.480
1985,2.926,2.870,3.458,2.351,1.914,0.847,0.951,3.177,2.447
1986,3.002,3.230,3.373,1.835,2.046,1.135,0.966,3.272,2.330
1987,2.792,3.166,3.485,2.235,2.021,1.195,0.978,3.297,2.535
1988,2.304,2.794,3.039,2.225,2.223,1.203,0.934,3.338,2.429
1989,2.859,1.960,2.217,1.942,2.133,1.507,1.069,3.453,2.367
1990,3.439,2.480,1.858,1.791,2.098,0.963,0.929,3.404,2.501
1991,3.854,3.014,2.435,1.951,2.187,1.104,0.942,3.274,2.656
1992,3.091,2.835,2.480,1.898,1.996,1.047,0.851,3.223,2.549
1993,2.923,2.406,2.228,2.048,2.081,1.301,1.217,3.358,2.614
1994,2.748,2.463,2.430,2.069,1.894,1.090,0.925,3.270,2.494
1995,2.639,2.459,2.496,1.875,1.547,1.335,1.068,3.128,2.484
1996,2.501,1.991,2.296,2.161,1.886,1.124,0.948,3.014,2.435
1997,3.053,2.201,2.369,2.120,1.762,0.995,0.963,3.204,2.433
1998,1.982,2.804,2.773,2.509,1.943,1.252,0.958,2.990,2.394
1999,2.485,2.978,3.249,2.492,2.153,1.029,0.699,2.772,2.059
2000,2.697,2.857,2.664,1.847,1.587,0.901,0.913,2.875,2.142
2001,2.369,3.100,3.063,2.115,1.802,0.807,0.946,2.772,2.132
2002,2.390,2.308,2.268,2.028,1.706,0.959,0.932,3.000,2.229
2003,2.223,2.128,1.799,1.911,1.975,1.364,1.047,2.994,2.182
2004,2.463,2.320,2.339,2.220,1.758,1.122,0.825,2.690,2.156
2005,2.590,2.422,2.164,1.988,1.795,0.836,0.875,2.782,2.293
2006,2.387,2.772,2.584,2.103,1.626,0.596,0.744,2.563,2.239
2007,2.254,2.209,1.999,1.439,1.271,0.794,0.795,2.611,2.094
2008,2.011,2.238,1.934,1.960,1.351,0.821,0.845,2.682,2.256
2009,1.996,2.080,2.019,2.045,1.519,0.870,0.967,2.620,2.194
2010,2.092,2.618,2.824,2.392,1.462,0.678,0.854,2.319,2.018
2011,2.287,1.634,1.747,1.544,1.407,0.902,0.952,2.447,1.860
2012,2.461,2.462,2.297,1.588,0.873,0.616,0.954,2.340,1.997
2013,2.269,2.342,2.345,1.888,1.339,0.771,0.807,2.261,1.916
2014,1.994,1.837,1.945,1.413,1.317,0.680,0.908,2.452,2.054
Fernando,
I'm more concerned with what the bulk of the pack is going to do. Barents has been consistently thinning throughout the record. The area of Laptev and Kara is small compared to CAA, Central, ESS and Beaufort.
Mr Reynolds, I understand. However, the Barents is definitely getting chewed up. Don't you think the total loss may be aided by the way ice has disappeared in the Barents? I also noted the comment about the Kara. As far as I can remember the Kara is fairly shallow, and rather small. I could be wrong, but I would look at the river flows and their temperature. I did some work in both the Kara and Pechora in the 1990's, and I seem to recall a link between the river flows and the subsequent ice development...maybe I'll ask some friends in Russia what they noticed? Or is that data being delivered in spite of the tension they have had with Putin?
Fernando,
For what it's worth, I think that Barents will be the first sea adjacent to the Arctic Ocean proper to be ice free in winter. Compared with the sort of extents seen in early 20th century maps from DMI it is staggeringly reduced.
River flows and temperature - I suspect that in winter what river flow there is will be at zero degC. But later in the spring and summer, yes I'm sure there' a strong role.
When I went looking for data on methane I got the impression that there was a large body of Russian Science almost in parallel with Europe and America/Canada. I had to buy some poorly translated papers direct from Russian journals.
The lack of access to the Russian's version of arctic science is frustrating. Like Chris, I found reference to many interesting looking Russian papers - but most of the time I was unable to find an English translation or even a Russian copy that I could run through a translation program.
In at least one instance I was able to see the transition of a Russian paper into a peer-reviewed English language version.
From that I would surmise the Russians are more willing to put guestimations and inferences into their papers; the English language versions ended up dropping some of their weaker claims based on reviewer comments. This part of what deniers simply don't realize or recognize; our 'best scientific understanding' is inherently conservative.
As an aside, it shouldn't surprise anyone that there are a large number of Russian climate scientists now working (and publishing) in what we would consider as western research organizations.
With many thanks to Chris for the data and apologies for the ungainly link, I thought I'd share the graph one gets upon combining several of the charts he included in his main post: https://docs.google.com/spreadsheets/d/1thu9G1P-vAgnTlqdm7Do-rdkBk9vAe1w7AmQwDS9IEc/embed/oimg?id=1thu9G1P-vAgnTlqdm7Do-rdkBk9vAe1w7AmQwDS9IEc&oid=207198290&zx=fbcm3db8lbe
I've omitted three seas here: the Central, because it hasn't yet properly reached 2 m thickness, and the Barents and Greenland, because they start out below that thickness (and because Greenland's ice is imported rather than produced in place, for the most part). With the exception of the Kara, it's quite easy to see that the various seas start out at different initial thickness but gradually converge towards ~2 m--which seems to me to support Chris' hypothesis quite strongly. The Kara, of course, is the major fly in that ointment. If its decline is due to an incursion of warmer Atlantic waters, I'm not sure but that that might mean that the Central Arctic might be expected to follow a similar thickness trajectory; it's similarly accessible to the Atlantic, and Fram Strait would seem to offer a fairly big hole in its defenses.
Hi Dromicosuchus,
You may want to consider changing permissions on that document, it's currently set such that potential viewers need to seek your permission.
With regards the Central Arctic, it is much deeper than Kara. The Atlantic Water layer can be seen in buoy profiles as a distinct warm layer whose upper extent is around 100m below the surface. The Atlantic Water is more saline and denser than the surface waters in the Arctic - salinity overcomes reduction in density due to it being warmer.
Changes in the Arctic Ocean may encourage more mixing, also diffusion may allow some of that (relative) warmth to reach the ice at the surface. But based on current behaviour I don't expect the Atlantic to play the same role in Central as in Barents and Kara.
Oh, heavens. Thanks for the heads-up; the access issues should be gone now.
Dromicosuchus,
Thanks for that, I'd noticed it but in amongst the noise of the data I didn't want to make an issue of it.
But if someone else is seeing it, that's good. :)
They do seem to roughly converge from being spread out at the start of the series to being closer at the end, and closer around 2m thick.
Post a Comment