The first part of this post is little more than a variant of trend extrapolation, although it doesn't use the fitting of a mathematical equation with the assumptions about future behaviour of the fitted function implicit in the equation form chosen to fit to.
I've taken 2000 to 2013 and calculated the interannual differences in September minimum volume using the PIOMAS daily main series. I've assumed a starting volume of 4.2M km^3 for the coming September, that's just a rough guess of a plausible number, not a prediction, it could be lower or higher.
Starting from that baseline for 2014 I've made a series of future interannual differences from 2015 to 2050, these have been applied to the starting point in 2014 to make an artificial series of possible future trajectories of September minimum volume from 2014 to 2050. This procedure has been done 25,000 times to generate the following two graphs.
The first graph shows the first year that zero volume is reached, the vertical axis is the sum of the number of series that give a zero volume in the selected year (along the horizontal axis). 2051 contains all years after 2050, the spike in 2051 is the sum of all years where zero volume happens after 2050.

I do not consider the extremely long tail to be plausible because this method doesn't take into account energy gain of the ice/ocean system, i.e. it's not a proper physical model. However the peak around 2020 does show that if volume losses continue into the future as they have done since 2000 then it is feasible that we will see a year of zero volume as early as around 2020. In essence the above distribution can be considered a probability distribution.
I've calculated the cumulative probability, where 1 is 100% probable, using the source data for the above plot.

This shows that by 2030 there is a 70% probability that a zero volume state will be reached in September. However because I doubt the physicality of the long tail in the preceding histogram, the 70% likely level will be reached sooner for the above calculations.
These calculations aren't ideal, Chris Randles has pointed out that a problem with the method of running from September to September is that there is no link between volume loss in a melt season and the volume gain in the following freeze season, a link that clearly exists. However as shown in my previous post, as the volume gains in the freeze season have increased in response to lower extents in September, so has the volume loss trend continued unabated. This method is really just meant to give an indication of what is plausible if the interannual volume losses of the past continue into the future.
However things may not continue the way they have done in the past.
September volume for the whole PIOMAS domain and for the Central Arctic are shown below.

It is clear that in recent years sea ice outside the Central Arctic has all but totally melted out by September. This shows the rather obvious conclusion that changes in the Central region will dictate what is to come in the future.
Within the Central Arctic a transition to younger thinner ice is underway, but is far from complete.

Whereas volume from grid cells reporting effective thickness of 2 to 3m remains level, that from 3 to 4m and over 4m is declining strongly. Whilst this thinning is happening grid boxes reporting 1 to 2m thickness are rising exponentially, having been a minor player in past decades.
Looking at the East Siberian Sea (ESS), in terms of volume in April and the melt season (April to September) volume losses gives a different perspective of the same change. Here since 2007 volume losses have accounted for all of the April volume, resulting in virtually no ice by September.

The same can be seen in Beaufort Sea.

In the Central Arctic region April volume is still some way off matching melt season losses, but along with the decline in melt season losses there has been a massive (50%) increase in melt season losses. Taking the average losses for 1978 to 1997 as a baseline, by 2012 the volume loss was 70% greater than that baseline average loss.

So why is the range increasing? I suspect it is the loss of multi-year ice (MYI) combined with the ice edge (and thinning adjacent to it) starting to impinge upon the region of the Central Arctic. The component from the loss of MYI may abate, but as the seasonal state of the peripheral seas entrenches (ESS and Beaufort being used as examples of this), so melt will impact the Central Arctic region all the more. So it seems to me that melt season losses will continue to increase.
However there is a reason to suspect that we may be near a change in the trend of loss for April volume in the Central Arctic. April thickness for Beaufort, Chukchi and East Siberian Seas has been around an average of 2.2m thick since the 2007 record melt year. If we take this as typical thickness of first year ice in April, and assume that this will be the typical thickness of the Central Arctic region within a few years (thickness was around 2.3m in April 2013), then with the Central region having an area of 4.43M km^2, such a thickness implies a volume of 9740.8km^3.
So if the annual range of loss kept increasing and the volume losses in the central Arctic would level within the next few years, then the intersection of melt season losses and April volume would be moved forward to around 2030.

As stated in my last post, it may be that I had been too impatient waiting for the thickness/growth feedback to stem the volume loss. It could be that it will only be once the Central Arctic falls to about the thermodynamic seasonal growth thickness that winter maximum volume loss will level off. If all of this seems ridiculous to you, then consider the alternative to an inflection in the trend of April volume in the Central region, continuing the trend regardless gives an ice free Arctic in April by 2037, surely nobody expects that!

So on the above graphic the horizontal axis is April average thickness for the baseline period, the vertical axis is the thinning between average thickness for the baseline period and average thickness for the recent period. Calculations being done per grid cell.
There are three distinct modes. 'A' represents the thinnest category of ice, which is shown little thinning, 'C' represents the thicker categories of ice, which have shown the greatest thinning (see Bitz & Roe 2004). What interests me here is region 'B', from about 1.5 to 2.2m, this should represent first year ice and the thinning over this region of the data should tell us about the decline in thermodynamic equilibrium thickness. In the time available for freeze over autumn and winter ice can grow up to around 2m thick. So any grid cell between 1.5m and 2m thick should be predominantly first year ice. The sub grid thickness distributions (gice) are now available for PIOMAS, but I've not had the time to get to grips with these yet, they might be a better way to find grid boxes with totally first year ice.
Taking the source data for the above graph and sorting it in order of April initial thickness allows an average thinning to be calculated, this is 31.7cm, taking the mid points of the baseline and recent periods as the timespan over which this thinning has taken place the average annual thinning is about 1.5cm per year. This thinning can be applied to the plot of melt season losses and April volume to adjust the estimate of when melt season losses equal April volume.

Notice that in this plot the red line slants down due to supposed continuation of a decline in thermodynamic equilibrium thickness. The date the projected melt season losses meet April volume (implying no ice at the end of the summer) moves forward four years to 2026. This is still no guarantee that melt season losses can increase to close the gap next decade. However if my rough reckoning of thermodynamic thickness reduction isn't too much, then by 2030 it would only take the same increase of melt season volume loss in the Central Arctic as has already occurred to close the gap and match April thickness.
I've previously blogged about percentage open water formation (%OW) and changes in this that have led to the peripheral seas within the Arctic Ocean becoming seasonally ice free. I've taken the non linearity of the relationship between initial thickness and %OW as meaning that rapid losses of ice will occur in summer leading to a fast transition to a seasonally ice free state. However on this matter I could be wrong.
In Holland et al it is stated:
As the ice pack thins, a given melt rate has a more direct influence on the summer minimum ice extent, as large regions of ice can melt away completely, accelerating open water formation. As such, "the efficiency of open water production" (defined as the percent open water formation per cm of ice melt over the melt season) increases nonlinearly as the ice thins.
The relationship between thickness and rate of open water formation suggests that there may be a critical winter ice thickness that is equal to the total potential for summer melt. Once the threshold is reached, large regions of the ice pack could melt away.However they go on to state:
While this is a reasonable idea, the reality of the model simulations is considerably more complex. Analysis of the seven ensemble members lends no evidence that a common critical state in the mean or distribution of ice thickness exists either regionally or at the basin-scale. Instead, the interplay of simulated natural variability and forced change influences the rate of summer ice retreat, contaminating any easily identifiable critical ice state and making the prediction of the abrupt transitions difficult.
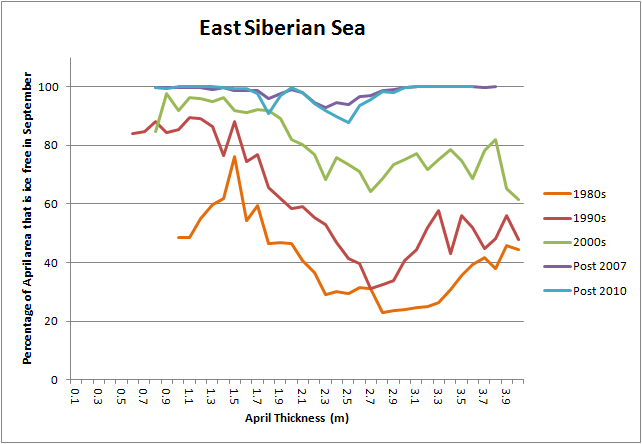
In the following graphs (using PIOMAS gridded data) on the horizontal axis is thickness of ice in April, and the vertical axis is the percentage of area occupied by a given thickness in April that becomes ice free by September.
The ESS shows that since the 1980s the curves of %OW have risen until after 2007 virtually all thicknesses of ice melt out to produce open water.
The situation is the same in the Beaufort Sea.
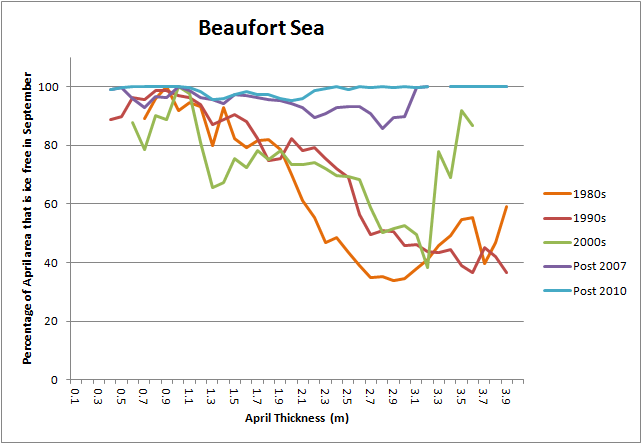
Both of these seas are now in a state that within decades the entire Arctic Ocean will be. Indeed all of the PIOMAS domain excluding the Central Arctic shows the same sort of behaviour.

While in the Central Arctic we are clearly only starting this process of transition. That noted it is worth looking at the rapidity of the upwards shift in the above graph between the 2000s (2000 to 2006) and post 2010 (2010 to 2013).
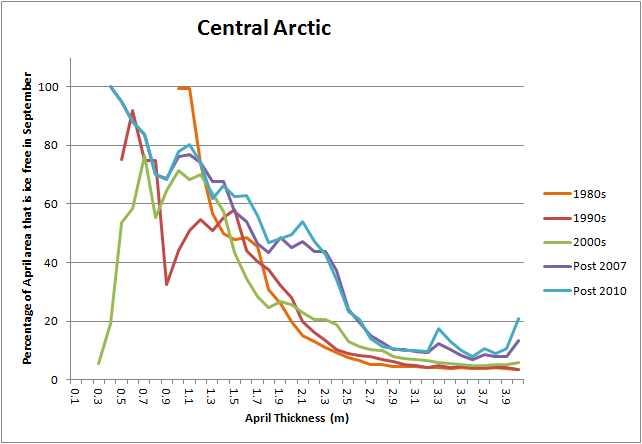
What is happening is that as the thickness profile drops the bulk of volume approaches 2m thick, the typical thickness of first year ice in April, and hits a region where the amount of open water formed increases non linearly, e.g. here. Ice growth in the peripheral seas of the Arctic Ocean is already around 2m (Beaufort to East Siberian Sea, and thinner in the Atlantic sector, probably due to Atlantic Ocean warming. This ice has typically almost all melted out by late summer in recent years. However for the Central Arctic to do so in the coming years requires summer melt volume to increase substantially.
In the 1990s Central Arctic summer melt was around 4k km^3, by 2012 this had increase by 50% to around 6k km^3, for summer melt to be almost as much as the volume implied by an equilibrium thickness of around 2m requires an increase in summer melt to over 9k km^3, approximately a further 50% increase. And none of the above reasoning takes into account the thicker ice off the northern coast of Greenland and the Canadian Arctic Archipelago. For as long as sea ice remains at the end of the melt season remnant multi year ice will be thickened in that region to well over 2m thick.
In the 1990s Central Arctic summer melt was around 4k km^3, by 2012 this had increase by 50% to around 6k km^3, for summer melt to be almost as much as the volume implied by an equilibrium thickness of around 2m requires an increase in summer melt to over 9k km^3, approximately a further 50% increase. And none of the above reasoning takes into account the thicker ice off the northern coast of Greenland and the Canadian Arctic Archipelago. For as long as sea ice remains at the end of the melt season remnant multi year ice will be thickened in that region to well over 2m thick.
It seems to me that the key issue is how quickly in can the volume of the Central Arctic be melted in one season. I don't consider a further 50% increase in summer losses inherently improbable, but I don't think it is guaranteed.
One major issue in the process not considered here is that with greater open water in summer more warming of the ocean will occur over the summer, prior to freeze up this heat needs to be vented to the atmosphere, this takes time so it can be expected to lessen the freeze season and lessen thickening. However thinner ice in turn allows more heat transfer to the atmosphere. To what degree will this process lead to thinner ice over the winter?
There are two competing powerful feedbacks, one centred on the ice/ocean albedo feedback (not to forget changes in ice albedo), and one centred on ice growth over the autumn/winter. Along with these feedbacks comes energy gains and losses. In the summer there is both sensible (that which can be sensed) warming of the ocean and the latent heat involved in melting ice. Countering the ice/ocean energy gain in summer is heat loss during the autumn (not to forget further winter heat loss due to thinner ice).
How will this play out? I don't know.
It wouldn't surprise me if it's well into next decade before we see an Arctic Ocean in summer largely ice free, apart from a remnant of under 1M km^2 extent off the coasts of the western Arctic Ocean. But on the other hand it wouldn't surprise me if we see a rapid crash driven by the ice albedo feedback with that state by around 2020.
References.
Bitz & Roe, 2004, "A Mechanism for the High Rate of Sea Ice Thinning in the Arctic Ocean." Journal of Climate. PDF
Holland et al, 2006, Future abrupt reductions in the summer Arctic sea ice. PDF.
16 comments:
oh, 2012 does not look too extreme on piomas. rather it's 2013 which looks more deviant. also it looks like central arctic piomas volume was nearly stable until 2002, fitting an exponential curve from 2002 onwards would no doubt yield a bit different result.
here's an eyeball of what I meant, I currently have no reason to try to be as scientific as you: http://3.bp.blogspot.com/-RiDNJMhT7tg/U1yEnnpHLsI/AAAAAAAAAYE/2X3GNGKOL7o/s1600/ChrReynoldsCentralAprilEyeballFit.png
Oale,
Yes the choice of function (and start date) is a major issue in terms of future behaviour. If it seems like I was arguing strongly for particular years that is not what I meant.
I had been expecting a rapid crash by around 2020 but that didn't take into account the issue of ice growth and potential loss in the Central Arctic.
Your plot shows a far more rapid meeting of the two curves. However I think it is probably too rapid. 2007 to 2012 looks to me to be more like a step jump in melt season losses with a slight linear rise on top, linear (by eye) extrapolation of the slight linear rise seems to me to meet the April volume curve around the same time as my long term quadratic fit, about 2026 - call it late 2020s.
I'm not ruling out a fast crash, your more rapid increase in melt season volume loss is sort of what I would expect from a fast crash. But critical to what happens in the future is what is causing the current increase in Central Arctic melt season losses - I don't have a 100% convincing answer for that, but it seems to me to be basically due to the increase of first year ice in the Central region.
In that sense if you go to the fourth plot of the main post, the red trace is ice 1 to 2m thick, that starts rising at about the same time as the melt season loss starts rising.
"However I think it is probably too rapid."
Yes, that was drawn a bit tongue in the cheek as might have been guessed by the brown bear. Could be there are other 2013s to come.
Seems to me the "Russian" half of the Central Arctic region should be intermediate between the peripheral seas and the area adjacent to the Canadian Arctic Islands. So couldn't one argue that it should become seasonally ice free by 2020, essentially leaving the September minimum to just have a band of ice against the Canadian Arctic Islands while the core of the Arctic Ocean is blue water?
In the 9th graph, the red line has been drawn by eye through densest regions. Instead of this you could just use a simple average for each thickness in the base period (86-95). I have worked out some averages below. However I am wondering if the average of all the thinning data for a thickness is what we want. Perhaps lowest 10% and highest 10% should be excluded and average the middle 80% to exclude unusual rates of thinning? Or maybe thin MYI shows slow rate of thinning so only lowest rates should be excluded to arrive at FYI thinning rate. Perhaps we need to see location of cells with high and low rates of thinning for their thickness in order to judge this?
Upto thick, Thinning, No cells
0.05 0.012625 544
0.1 0.039512 379
0.15 0.052066 290
0.2 0.054725 270
0.25 0.024543 187
0.3 0.033331 160
0.35 0.033191 148
0.4 0.016789 156
0.45 0.000714 161
0.5 -0.00793 140
0.55 0.023515 145
0.6 -0.00319 137
0.65 0.030771 143
0.7 0.016611 133
0.75 0.046062 122
0.8 0.017486 133
0.85 0.036872 146
0.9 -0.00289 155
0.95 0.017624 155
1 0.024052 154
1.1 0.016633 332
1.2 0.114822 285
1.3 0.197466 246
1.4 0.214475 317
1.5 0.233391 465
1.6 0.225696 573
1.7 0.236094 452
1.8 0.265252 389
1.9 0.281049 397
2 0.348766 353
2.1 0.470283 387
2.2 0.469196 347
2.3 0.483397 357
2.4 0.521745 458
2.5 0.563506 571
2.6 0.544019 722
2.7 0.555709 551
2.8 0.621021 641
2.9 0.713077 558
3 0.718345 483
3.25 0.820449 766
3.5 0.944344 585
3.75 1.079212 469
4 1.134068 450
5.56 1.401121 1734
On the 10th graph, can you calculate the area of the central Arctic times the thickness of first year ice for 2013 and 2030 and plot this as a straight line.
Thicker MYI has been thinning faster but presumably as the MYI diminishes the actual volume will approach the above strainght line representing the volume that there would be if it was all FYI.
I think it would help judge the realism of what you are arguing if we could see how much further down there is to go from thinning of MYI and conversion to FYI.
one thing that might do some damage to the integrity of older ice is the methane that could be integrated to the ice thus keeping the underside warmer than it would otherwise be, so the faster demolition of the ice isn't too easily excluded. maybe someone has measured if there are any differences in this within ice
Nightvid,
Yes, I keep pondering whether the Central Arctic needs to be broken down further, and eastern / western Arctic split is one possibility. I agree the further inroads into the central region from the Siberian side are what will probably follow.
Oale,
The dominant process of heat transfer within the ice is conduction, not radiation. So methane in bubbles within the ice will have little impact IMO.
Crandles,
Including all thinning by using an overall average seemed the most conservative approach, as can be seen by the graphic the lower density of points of largest/smallest thinning implies a low impact. However as we've discussed - doing it by eye based on that graph gives a little under 2cm/year thinning. That's less than my calculation of the overall average. As the figures you post show there is significant variation of average thinning, from 23cm at 1.5m to 50cm at 2.2m, my calculation of 31.7cm is merely for the whole April thickness interval from 1.5 to 2.2m.
The 10th graph is merely based on the same numbers as used for the 8th graph (I really should go back to using figure numbers!), but with a yearly thinning applied. The 8th graph uses the assumption of 2.2m (FYI) multiplied by the area of the Central Arctic region.
The area of the Central Arctic, sum of PIOMAS grid boxes in that region, is 4,427,645km^2.
Chris,
Have you looked at
https://sites.google.com/site/arctischepinguin/home/piomas
yet? Near the bottom of the page there is a "location-specific" extrapolation of PIOMAS thickness to year of ice disappearance, it would be interesting to see how your method would compare to it.
Nightvid,
Yes I am aware of that. But the point I am making is that there may be an inflection in the rate of loss because much of the Central Arctic now lacks thicker multi year ice, and the MYI accounts for much of the overall volume loss.
So trend extrapolation, even when done per grid box wouldn't pick up the inflection my argument implies.
Oale,
You should have a polar bear image on your extrapolation graph, not a brown bear...
still a brown bear, but a negative one, sky added. http://4.bp.blogspot.com/-haddIt6Q86s/U2I06vuLLdI/AAAAAAAAAYU/3o8n9aquEBg/s1600/ChrReynoldsCentralAprilEyeballFit.png
Too tired on May Day to find a copyfree image of a polar one.
Nightvid, Oale,
I took the brown bear as a comment on the future of Polar Bears - if we have enough fossil fuels, Polars and Grizzlies will probably end up mating, so Polars will decline as a distinct species...
;)
The circulation pattern actually looks good for ice preservation heading into mid-May. A generally +NAM with the PVA over the Beaufort/Central Basin. We can thank the FW for this, as the SAO flip no longer dominates the +QBO wind field in the upper sigma levels.
This should progress as we head into June, with a generally +NAM with "blips" in the regime developing into June. Instability in this regime will oy increase as we head into late summer with a higher likelihood (50-60%) of a flip in the NAM associated with the transition into an El Niño/+QBO/Solar Max forcing regime.
PHz13,
Can you clarify FW, and SAO? As for potential vorticity (PVA) - you're getting beyond me here, my maths have never been strong enough to follow vorticity.
Post a Comment