There is really only one issue I can move on to address now, and that is the future of the sea ice.
Stroeve and Barrett have produced a set of slides for a presentation on CMIP5 (Coupled Model Intercomparison Project 5) models reproduction of Arctic sea ice metrics (see refs at end). CMIP5 being the latest generation of GCMs that shows improvements in terms of sea ice compared to CMIP3. In the following graphics SRESA1B is an emssions scenario used with CMIP3, RCP4.5 is a emissions scenario used with CMIP5.
Firstly it's worth looking at the seasonal cycle.
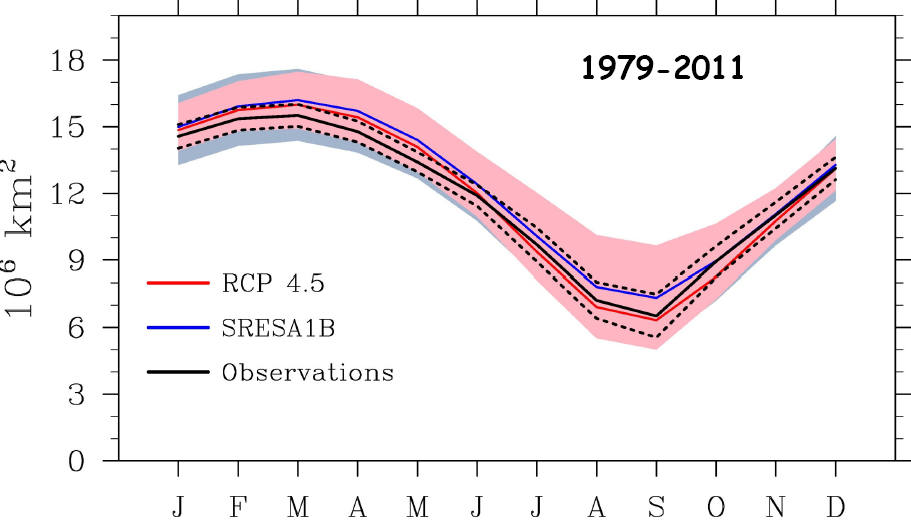
Whilst the seasonal cycle in CMIP5 (RCP 4.5) covers the observations, there appears to be a high bias from winter to summer, with observations occupying the lower end of the CMIP5 spread (red). This is important because the seasonal cycle is a critical measure of a model's response to an externally forced perturbation of the sea ice. Human driven climate change and the increase in July 65degN insolation during the Holocene Climatic Optimum are two examples of an externally forced perturbation of sea ice that has lead to severe sea ice recession in the Arctic. However the seasonal cycle due to changes in surface insolation is also an externally imposed perturbation, albeit one with an annual cycle, as opposed to acting over many years.
Wang and Overland updated an earlier paper and used the fidelity of seasonal cycle of modelled extent to observations to select a subset of the models that best reproduce the seasonal cycle, on the basis of response to external forcings as described above. Using this subset of GCMs, they find that a September extent of less than 1M km^2 is likely only by the 2030s.
The following graphic will be familiar to those following the Arctic, showing observed sea ice extent for September (black) for the period 1979 to 2011, compared with CMIP3 (blue) and CMIP5 (red).

Here CMIP5 is shown to be a large improvement on CMIP3, and in terms of extent one could construe the observations as being similar to a conceivably aggressive ice loss episode in CMIP5. However one has to consider what is driving the observed decline of extent, and regular readers of this blog will know that I am convinced that volume is the driver. As volume declines so does thickness and the seasonal thinning from April to September is then able to expose open water more easily, resulting in a decline of sea ice extent.

The intimate relationship between extent and volume for the September average is shown by the above scatter plot, with a simple power function seeming to me to be the simplest way to make both reach zero at the same time.
In the case of CMIP5 models, once again one could charitably interpret the PIOMAS decline in volume as being an instance of aggressive volume decline within the range of CMIP models. Considering the top plot, MIROC I think, there is a similarly aggressive decline in the early part of the 21st century, albeit from a much higher baseline volume (or thickness).

The above graphic bears out a comment I've read in a paper (can't remember which paper) to the effect that volume decline in CMIP models is related to initial thickness, the thicker the ice is initially the greater it thins and the greater the resultant volume loss. Bearing this in mind it seems hard to take the charitable interpretation of PIOMAS as an aggressive volume melt in line with the CMIP5 volume losses, because PIOMAS does not start from a very high initial volume, even taking into account the Lindsay and Zhang paper discussed previously where PIOMAS volume in the 1980s is about the same as in the 1950s.
Restating the findings in the final page of the Stroeve/Barrett presentation:
- In general, CMIP5 models better capture the observed decline in Arctic sea ice than CMIP3.
- In general, the models exhibit a stronger seasonal cycle in both sea ice extent and ice volume.
- Large inter-model scatter remains in both ice extent and ice volume, particularly during summer.
- The spatial variability of thickness, a large-scale slowly varying climatic feature of the ice cover remains not well produced by the majority of the models.

So which is correct, the GCMs projecting survival of a perennial sea ice pack into the 2040 (and beyond) or PIOMAS? A clue here is that the other model producing aggressive volume decline is the US Navy Postgraduate Naval School's model, NAME.
In a 2009 conference presentation, shown in this document from FreshNor, Maslowski drew linear trends from NAME October/November ice volume to hit zero around 2012 to 2016, although in reality, as drawn on the graphic there is a supposed remnant of ice surviving summer melt. In the more recent Maslowski et al 2012 NAME modelled volume reaches about 1.4m thick ice in the summer by 2004, unfortunately I can't find further results beyond that date. However it's worth noting that 1.4m is in the same ball park as PIOMAS which has a late summer thickness of about 1.2m in 2004, link.

It seems to me that the link between PIOMAS and NAME that is key to the aggressive volume decline is that both assimilate atmospheric data and sea ice concentration data, so they are constrained by observations of actual changes as they proceed to model sea ice and model volume. Whereas GCMs are hindered by problems such as that found by Boe et al: That the models tend to create too strong a boundary layer inversion which means a far cooler atmosphere and stronger ice formation. That study relates to CMIP3 models, CMIP5 seems to have the same problem, but I've not got the time to properly delve into that - this isn't my day job, sorry.
Another significant issue with GCM's as opposed to assimilating models (PIOMAS and NAME) is that of albedo. Koenig et al find that CMIP5 GCMs have a massive spread in albedo (e.g. 0.3 to 0.7 for July) and that the models fail to reproduce the seasonal evolution and distribution of albedo changes. Whereas assimilating models will pick up impacts of albedo changes due to both temperature assimilation (2m temperature) and sea ice concentration assimilation. This issue is particularly important because whilst April volumes do not suggest a rapid transition to ice free in the summer, the greater loss of volume in spring/summer (notably post 2010 in PIOMAS) does have the potential to play a role in severely reducing summer volumes in the coming years. Previous related posts, The PIOMAS Spring Volume Loss, Sea Ice Albedo Changes and the Seasonal Cycle.
PIOMAS has been used to project sea ice volume into the future. In Zhang et al 2010, PIOMAS was fed simulated future data using available NCEP/NCAR weather for past years which was applied randomly to a regional warming scenario derived from emissions scenarios applied to a GCM. The volume projections are shown below. Dotted lines are for September mean ice volume, solid lines for annual, after 2010 the IPCC emissions scenarios are as follows: green is A1, red is A2, blue is B1, black is B2.

Those issues aside, Zhang et al find that the reason for the long persistence of sea ice volume is that thinner ice has a faster growth rate over autumn/winter, so as volume loss through the spring and summer increases so does volume gain over autumn and winter, this is known as the thickness/growth feedback.
The following scatter plot shows volume gain in the melt season as a function of NSIDC Extent at the end of the preceding melt season.

There is a strong relationship (R2 = 0.65) between the two variables, in simple terms; the lower extent gets at the end of the melt season, the greater the volume increase in the following melt season. It should be noted that as the recent years have shown greater losses, stretching data points towards the top left, so the growth in the following melt season has been all the more vigorous.
However despite this strong negative feedback, volume at the end of the melt season has continued to plummet. 2013 was an anomaly due to weather, not part of the long term trend.

I've been waiting for this negative feedback to stem losses, and have in the past few years had concluded it won't. But in my next post I will show why I may have called it too soon, and why although GCM projections of summer perennial ice well into this century are not supported by the evidence, the first year with a virtually sea ice free state may be around 2030.
References.
Boe et al, 2009, Current GCMs’ Unrealistic Negative Feedback in the Arctic, PDF.
Koenig et al, 2014, Summer Arctic sea ice albedo in CMIP5 models, PDF.
Maslowki et al, 2012, The Future of Arctic Sea Ice, PDF.
Stroeve & Barrett presentation, Assessment of Arctic Sea Ice in the CMIP5 Climate Models, PDF.
Wang & Overland, 2012, A sea ice free summer Arctic within 30 years-an update from CMIP5 models. Abstract.
Zhang et al, 2010, Arctic sea ice response to atmospheric forcings with varying levels of anthropogenic warming and climate variability. Abstract.
7 comments:
Great way to leave on a cliff hanger! Just from looking at the volume and thickness charts, I've thought there might be a natural feedback to slow down the drop in September minimum for a while. I'm very interested to see what you have to say about the mechanism and its strength.
A few years back (2012?) the UKMO did a report (possibly for the House of Commons) that referred to their sea ice model and its projections for future loss.
IIRC it did a far better job than even CMIP5 (as you'd hope). Unfortunately though I can't remember any more than that and search of their website throws nothing up.
Their 2012 page on the Arctic states 2030 as likely the rough earliest date for < 1M km^2, though.
If I find the report I'll post a link.
Okay, I've found it and it seems I was wrong. I think I was misremembering this paragraph from Dr Slingo's oral evidence as referring to a sea ice model, when it probably refers to one of the HadGEM models:
"We run quite a sophisticated sea ice model that includes the volume of ice, and it is fair to say, yes, there is a decline in the volume of ice. The observational estimates are still very uncertain, and we are looking forward now to the new measurements from CryoSat-2, which will give us a much better sense of the thickness of ice around the Arctic as opposed to just the extent of ice."
From: http://www.publications.parliament.uk/pa/cm201213/cmselect/cmenvaud/171/120314.htm
Written evidence here: http://www.publications.parliament.uk/pa/cm201213/cmselect/cmenvaud/171/171we15.htm
Report (pdf) here: http://www.metoffice.gov.uk/media/pdf/p/i/HCTN_91.pdf
None of this will be new to you - it's all from Feb/Mar 2012. Sorry for the noise.
Carmiac,
I had hoped to post part 2 yesterday, but I've decided on a slightly different tack and won't have the time to crunch the numbers until the weekend. Sorry to leave you 'hanging'. Essentially my argument hinges on whether volume loss will continue in the Central Arctic and whether it is possible for ice 2m thick to melt all the way from the peripheral seas through the Central Arctic in one season.
Adam
Actually I've not read that HCTN report. Thanks.
I see that as you say figure 4.1.2 shows area under 1 million kmsq by around 2030. Overland/Wang propose that virtually sea ice free should be considered as under 1 million kmsq extent, not area. So at 1 million area extent will be somewhat higher.
Chris,
I don't think there is any good reason to believe the ice has to melt from the edges inward - it certainly didn't do that in late August 2006 or early August 2012.
When the ice in the central Arctic in May is thinner than the top plus bottom melt that results from the conditions that season, it will melt, regardless of how far in the ice pack it was early in the season!
Area vs Extent - missed that, schoolboy error. :-/
I may have this wrong, but the way I see it is, at 1-2M km2 though, it really wouldn't take much weather to double or halve the amount.
For example the difference between 2012 and 2013 min in both measures was similar to the difference between the two, and roughly 1-2M km2 (I've rounded massively, but they're all within that ball park).
Therefore, once we're down to frequent <= 2M km2 amounts in either, it's basically a die roll from year to year.
Of course, it would also mean some years could get a doubling from the previous year, too.
One extra though, is that would extent start to proportionally larger than area at those levels? Or would sparser ice clear out more quickly, and leave mainly fast and solid ice meaning the two measures (ignoring melt ponding) would get closer?
Does anyone have a model of what happens when you get down to those levels, and what form the ice will take?
Nightvid,
There's the simple fact that until now, which the pack typically thins over summer, you don't get large holes within the pack.
It's feasible that might change as the Central Arctic region transitions to a sea ice free state. But on balance I think there is reason for doubt about whether it is feasible to melt out the Central region with ice thickness around 2m. More in my next post (should be tomorrow morning).
Adam,
I agree. Especially with regards weather having greater impacts.
As to what will happen as the pack continues to thin, I think we'll see lower concentrations in late summer. And area may go down faster than extent.
Post a Comment