To start with here's a blink comparison between February 2013 and February 2014.
The strongest difference is in the Central Arctic off the Canadian Arctic Archipelago (CAA) and northern Greenland, the ice here is shown in blues as it is over 2m thick. This region shows thicker ice than last year in terms of volume, as will be shown further down this post. This is also seen in Wipneus's plot of the thickness difference between 2013 and 2014, see here.
Looking at PIOMAS Volume breakdown by region for February 1978 to 2014 shows that it is indeed in the Central region that the main volume increase persists, all other regions are within the range of variability for recent years. Kara shows a drop in 2012 and 2013 related to thin ice being prevalent in Barents and Kara over the those two years. In 2014 ice volume in Barents remains low.
In my previous post I argued that it was likely that the lack of thickening compared to 2013 leading to a reduction of volume compared to 2013 was not just due to the Pacific and Atlantic peripheral regions of the pack but was also affecting the interior of the Arctic Ocean ice pack. This seems to be the case.
Apart from the East Siberian Sea (ESS) and Kara Sea, all regions of the pack have a lower difference between 2014 and 2013 in February as compared to January. The drop between January and February in the interannual difference for the whole PIOMAS domain (ALL) is staggering, and much of this is seen to be due to regions within the Arctic Ocean (Beaufort to CAA - as listed on the horizontal axis of the graph below).
Looking at the timeseries of thickness distribution for the entire PIOMAS domain (All Arctic) shows that only in the 3 to 4m thickness category is there a large increase in volume. Volume of ice up to 1m thick is reduced from recent years due to the lesser area in Okhotsk and Bering, and the slightly greater volumes in 1 to 2m and 2 to 3m thickness bands. The transition of ice from 2 to 3m (green) to the 1 to 2m (red) category seen after 2007 remains in 2014.
Comparing the thickness distribution for 2013 and 2014 for the entire PIOMAS domain shows that the two are very similar, although there is a thicker tendency in 2014.
However when compared with other previous years the similarity between February 2013 and 2014 is marked. 2014 is more like 2013, with the other years suggesting a thicker thickness distribution.
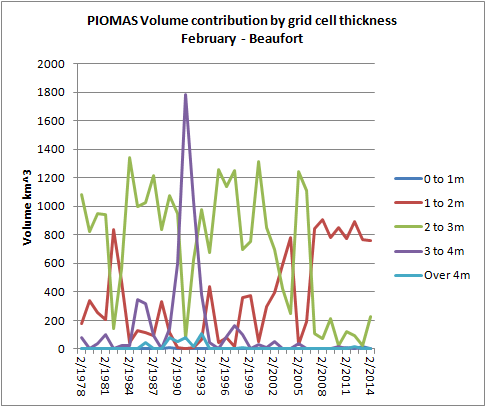
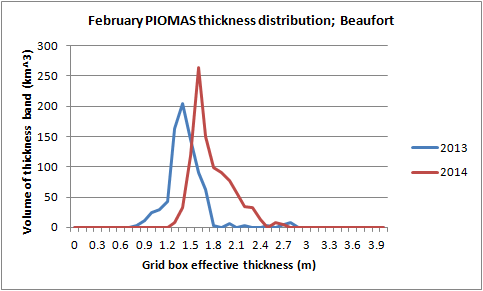
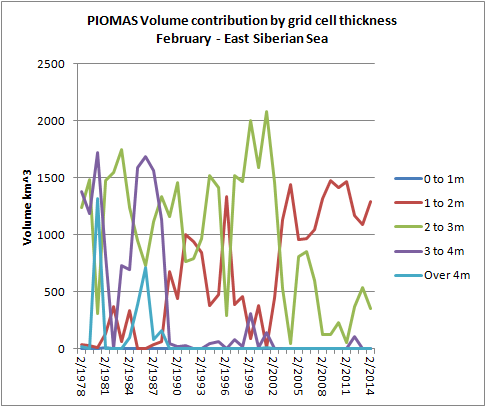
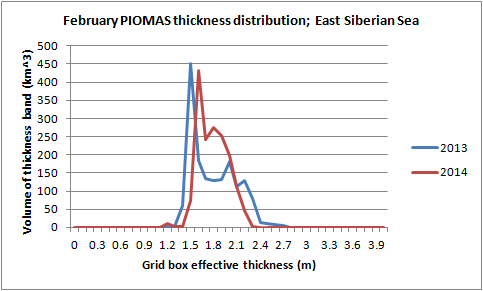
As in previous posts, to avoid getting lost in excessive detail I have presented the Beaufort Sea, East Siberian Sea (ESS), and Central Arctic as three key regions, representing the North American, Siberian and central Arctic (multi-year ice) states.
The timeseries of volume contribution from five thickness bands for Beaufort does not show anything unusual; 2014 is shown to be one of a set with the other post 2007 years.
However, as was noted in 2013, the thickness distribution for Beaufort was very thin, this year it is notably thicker.
That noted, when compared to other post 2007 years 2014 is about in the middle of thickness distributions. And as I've argued previously, and as apparent from regional CT Area, Beaufort is already a virtually seasonal sea. So I don't think the marginal thickening as compared to 2013 means substantially less ice loss in the coming melt season than other post 2007 years, indeed 2012 showed a thicker distribution despite the following record melt.
As with Beaufort, the ESS shows conditions similar to recent years.
And despite a marginally thicker profile the difference is not great.
This similarity is seen when compared to other post 2007 years.
So conditions in the peripheral seas do not seem such that one could conclude that volume (thickness) would lower the chances of these seas one again becoming virtuall ice free in late summer 2014.
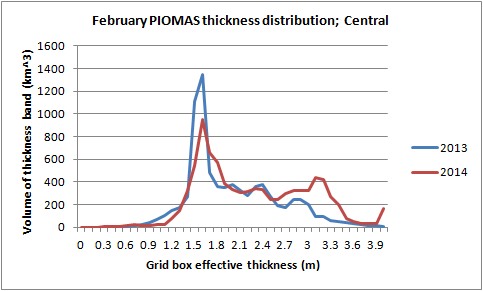
As indicated in the first plot of this post, conditions in the Central Arctic do however suggest thicker ice. This is restricted to the 3 to 4m thickness categories, which are restricted to the region off the CAA and northern Greenland.
This thickening of the thicker ice is seen in the comparison of 2014 thickness distribution with 2013 as a rise in volume, which is mainly from 3 to 3.5m thickness
In terms of other recent years this presence of thicker ice is seen to be of the same order as 2010, and despite a small recovery for 4m and above thickness, there is still a lack of the thickest ice (>3.5m) which is present in 2007 (and earlier - not shown).
My reading of February conditions is that the main volume gain compared to 2013 is limited to a small region adjacent to the CAA and northern coast of Greenland. This is a region nobody seriously expects to melt for some time. In the rest of the Arctic Ocean it is hard to tell February 2014 apart from other post 2007 Februaries. The 2013 volume pulse has had far less impact than I had expected, and due to the negative PNA pattern of February has been shorter lived, this has surprised me. The 2010 volume loss's impacts remain, and after that event 2011 matched 2007's record, and 2012 beat 2007's record by a large margin. Weather seems to be the major factor governing whether we will see a normal melt for recent years, or whether we will see a new record set this year.
******
All of my sea ice data has now been updated. PIOMAS regional data derived from the gridded PIOMAS data, as used in this post, is provided from this page (scroll down to 'The Data'). New to that page is daily volume broken down into regions from newly released PIOMAS daily gridded data. Also after a long break without updating (sorry) my sea ice data spreadsheet is updated, click here, and download rather than trying to use Google Sheets, the spreadsheet is for Excel 2007 and later.






No comments:
Post a Comment