The plot of PIOMAS total volume shows that during February the volume has relaxed back to the same level in 2013 at the end of February. So at face value the 2013 volume gain appears to have lasted only one freeze season.

The average gain from 1 January to 28 February from 2008 to 2013 is 2.610k km^3, this year the gain has been 1.922k km^3, so the gain over that period this year is 26% below average. However the crucial question is where this lack of volume gain has come from, is it from within the Arctic Ocean, in which case it has the potential to affect conditions at minimum and the prospects for the 2014 melt season. Or is it from outside the Arctic Ocean, in which case the impact on the coming melt season probably will not be significant. To answer that definitively it would be necessary to have access to February's gridded PIOMAS data, as I write this has not been released. However it seems to me to be possible to work around the problem.
Using gridded PIOMAS data I've previously calculated volumes attributable to the regions used by Cryosphere Today. So it's a simple matter to calculate the typical gains for within the Arctic Ocean (including the Canadian Arctic Archipelago) and the seas outside the Arctic Ocean. For the period 2008 to 2013 the Arctic Ocean gained an average of 2.130k km^3 the seas outside of that region gained 0.895k km^3, in terms of the total volume gain this is a 70/30 split.
I've plotted the difference between the current date and a year previous from January 2013 to end February 2014. As well as that plot I've added Cryosphere Today Area (CT Area), area is in M km^2, volume in k km^3.
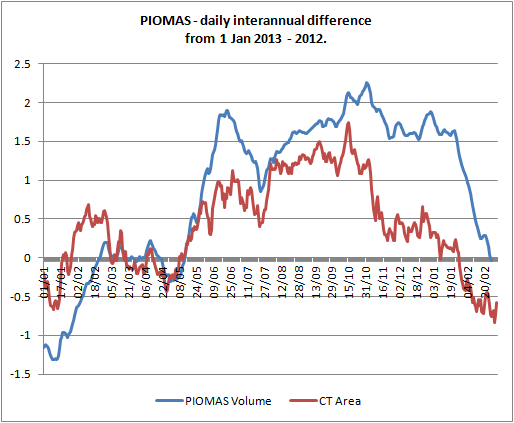
It can be appreciated that area growth difference stalled in November and levels dropped from being high relative to 2013 as the remaining ice area was greater in late 2013 as compared to the record loss year in 2012. Once the ice edge proceeded out of the Arctic Ocean CT Area levels were similar to 2012, 2013 being only slightly above 2012. However throughout this volume levels remained high in late 2013 compared to 2012 because 2013's melt season ended with so much extra volume. Indeed the 1.5k km^3 increase in levels relative to 2013, starting from spring 2013, largely remained until early February.
I've plotted NCEP/NCAR atmospheric temperature above the surface (500mb) so as to examine the possible role for heat transport into the region, surface warm anomalies can be associated with heat flux through thin ice and polynyas so aren't particularly instructive. Large surface anomalies in the Atlantic sector are currently present but these are directly due to lack of ice where there was ice in the climatological mean period.
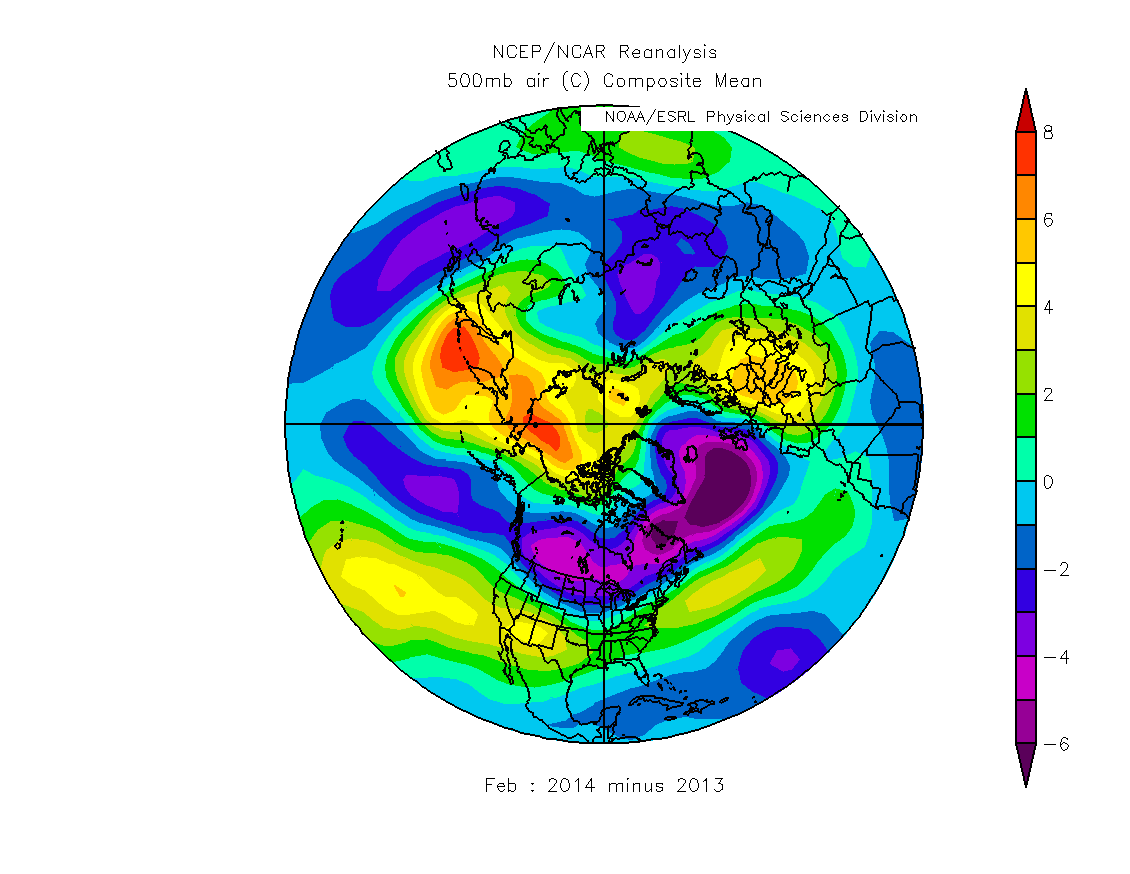
So a negative PNA pattern seems to have impacted circulation and caused February gain in volume to be less than in recent years. However this happens at the same time as CT Area drops below February 2013, so could a lack of ice growth, mainly in the Pacific seas be the cause of the reduced volume growth in the PIOMAS data?
In total throughout February relative to 2013 there has been a loss of around 1.5k km^3 volume, could this be entirely due to conditions outside of the core of the Arctic Ocean? Total volume in Okhostk and Bering in February 2013 was 0.733k km^3. However Barents Sea and Greenland Sea areas are also down on 2013, leading to a notably retreated ice edge in the Atlantic Ocean sector, in 2013 these accounted for about 1k km^3. Due to the cold pattern of this winter sea ice in Hudson Bay is equal to last year and and Baffin Bay is greater than last year. So if there were virtually no ice in Okhotsk, Bering, Barents and Greenland, one could explain the drop in volume in February. But the ice hasn't retreated totally, and is certainly not so absent that it could totally explain the February volume loss with respect to 2013.
As mentioned above, the split of total average January to February volume gain (about 3k km^3) between regions inside and outside the Arctic Ocean is 70/30, with the bulk of the volume gain being in the Arctic Ocean. Given that the seas outside of the Arctic do not seem capable of accounting for all of the volume loss in the difference between 2013 and 2014, and that there is a large region of warming aloft above the pack within the Arctic Ocean relative to 2013, I think that on the balance of probabilities there must be a substantially reduced rate of thickening during February within the Arctic Ocean. This has the potential to reduce thickness within the Arctic Ocean and may mean that the impact of the 2013 volume pulse will be very limited, opening up the possibility for losses of the same order as 2011 or 2012 in the coming melt season.
4 comments:
"... I think that on the balance of probabilities there must be a substantially reduced rate of thinning during February within the Arctic."
Do you mean "reduced rate of thickening"?
Thanks Nightvid, corrected.
I think PIOMAS gridded data is now out...am I right? (My computer can't view the files)
Yes it is, new post written, but I'll post this afternoon, been a long morning after a long week and I'm treating myself to a doze in front of the TV.
Post a Comment