Using my usual 1980 to 1999 average I've previously calculated anomalies from that long term mean, in the figure below the spring volume loss is shown.
The PIOMAS volume anomalies show that there has been an increasing downwards trend in the summer, however since 2010 there is a regular pattern of steep drops in volume over May and June, notably the switch from anomalous spring loss to gains in anomalies (less than average melt) over the summer happens at around the solstice, June 21st. I'll post about the summer anomaly gains in due course, for now it is the earlier anomalous volume losses that interest me.
A first consideration when looking for a candidate is the weather, however although average sea level pressure over the Arctic Ocean for May and June is low for 2006 to 2009 and high for 2010 to 2013, which might suggest a role, the spring melt is rather too well timed in 2010 to 2013. So I suspect that we're not looking for weather related effects, and the most likely candidate that is regular from year to year is the sun. However as 2013 shows, with a more muted spring melt, weather does seem to play a role in intensity.
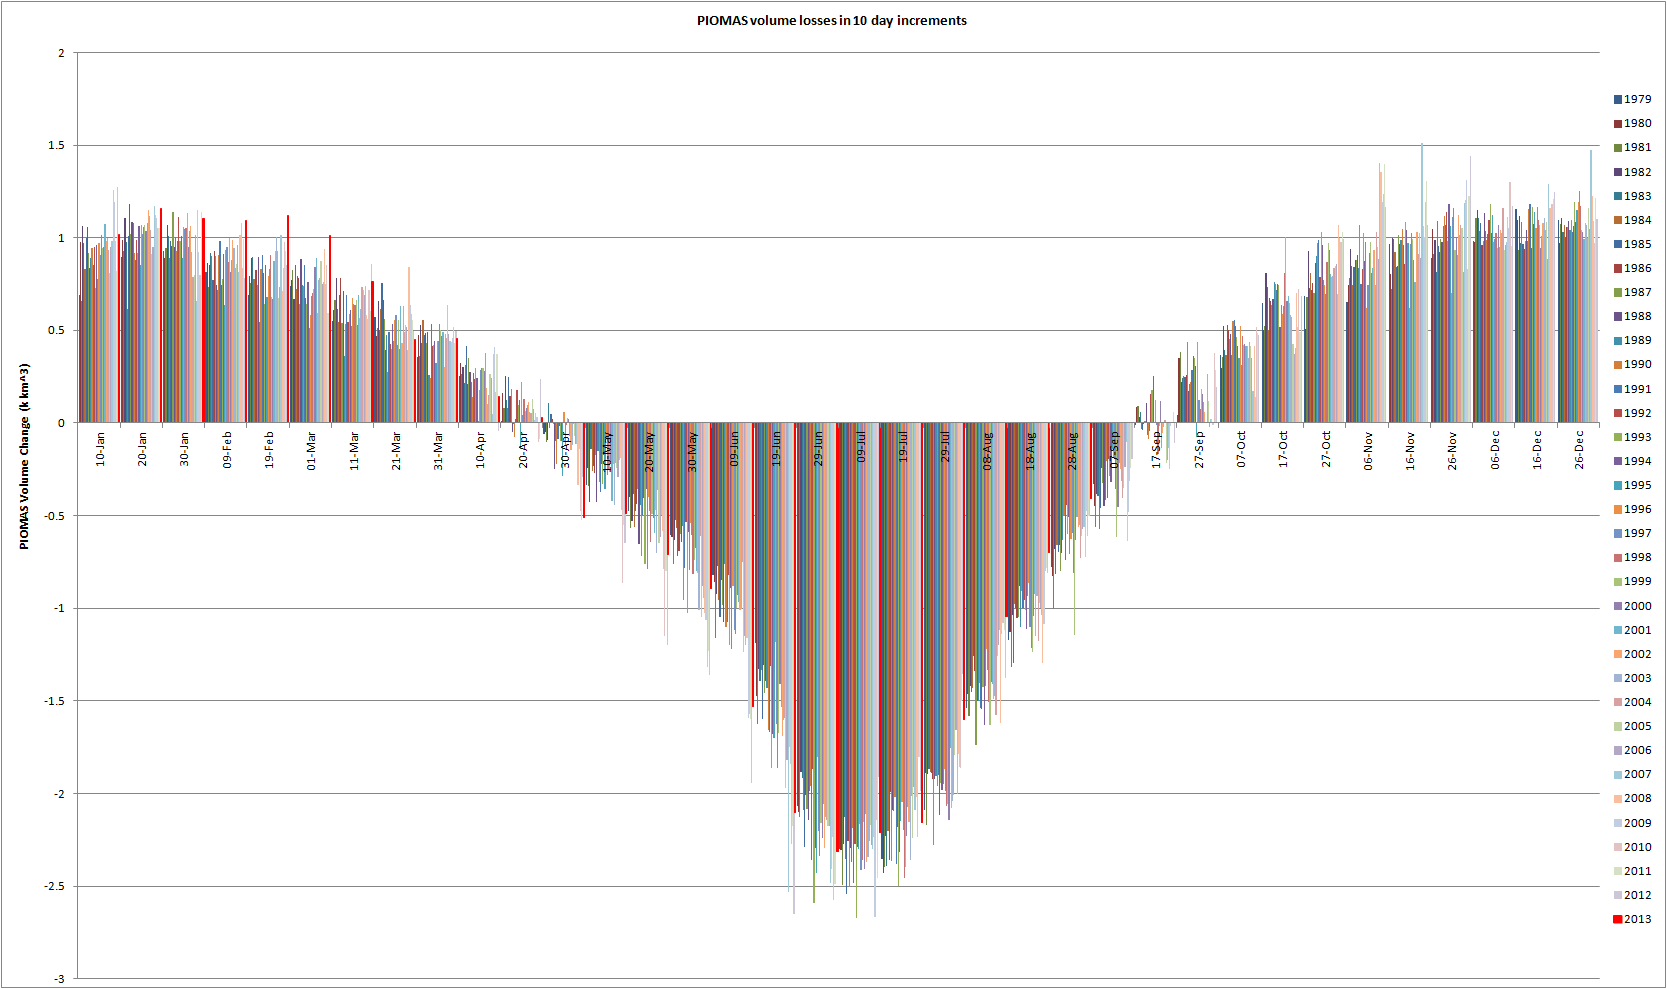
PIOMAS volume changes in ten day increments shows that the volume loss follows the seasonal cycle, with volume loss peaking shortly after the solstice.
That appears to explain the end of the spring volume loss period, I suspect the beginning is timed by sunrise in the eastern Arctic, particularly the increasing angle in the sky and the sharp increase in hours of sunlight through April.
The spring volume loss can be seen in the following plot using PIOMAS monthly gridded data to break volume down into regions.
However by working out anomalies from the 1980 to 1999 average loss, it is apparent that the Central Arctic is the largest player in the spring volume loss increases of recent years. 'Axis Title' should read 'Volume Anomaly km^3'.
This is no surprise given that the Central Arctic is the largest region in the Arctic Ocean. However what becomes apparent, bearing in mind the behaviour shown in the first plot of this post, is that although losses are increasing around the Central Arctic, whatever is the cause the losses are greatest within the Central Arctic by a large margin in 2010, 2011 and 2012, years with the steepest spring volume losses.
Concentrating on the Central Arctic Region I've broken down the spring volume loss into it's component contributions from grid cells of various thickness bands.
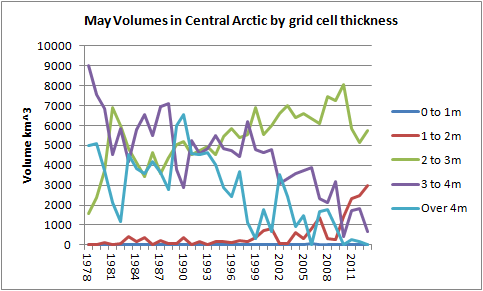
Striking behaviour can be seen, although from 2009 onwards, not 2010. There has been increased volume loss in the band of grid cells from 2m to 3m thick, with a consequent substantial increase in volume in grid cells 1m to 2m thick caused by ice thinning from the thicker to the thinner category. Note that the same effect occurs between the 3 to 4m and 2 to 3m categories earlier in the series (purple and green lines).
The situation in 2009 is however different from the post 2010 period as can be seen from the May ice state.
In 2009 the volume of grid cells 2 to 3m thick is reaching a peak, this is the outcome of a long term process of decline of volume in thicker grid cells. By 2010, before the bulk of the 2010 volume loss event, volume of grid cells 2 to 3m thick exceeds 8000km^3 for the first time in the series, the average volume for grid cells 2 to 3m thick in May 2011 to 2013 is down to 5568km^3, with a responding increase in the 1 to 2m thick category. Volume in the Central region in 2009 is only 245km^3, with 2010 up to 1408km^3 and the average for 2011 to 2013 being 2601km^3. So the 2009 spring volume loss in the Central region is not accompanied by the shift to the 1 to 2m category seen in May following 2010.
The spring volume loss is not confined to the Central Arctic, however aside from 2013 the post 2010 years show such a volume loss, and although increasing volume loss from the peripheral seas plays a role, the big player in 2010, 2011 and 2012 is the central Arctic, where the volume loss seems to be a result of thinner ice engaging in melt earlier than in the past, hence the drops when compared to the long term average. 2013 shows that weather has role in the size of the spring melt, however despite poor weather, 2013 still shows an anomalously large spring melt, which was due to the peripheral seas rather than the Central Arctic region.
This intense loss of volume in the spring, as opposed to past years, is important from the point of view of the ongoing transition to a seasonally sea ice free state. For there to be so little ice by September there needs to be much more volume loss during the season, greater loss of volume is needed in the early melt season for this to happen, and the spring melt is likely to be a part of that equation. If, as I argue, the spring volume loss is due to sea ice conditions rather than weather alone, we can expect it to be a regular part of the seasonal cycle in years to come, and for it to intensify as the Central Arctic transitions to a seasonally ice free state, as the peripheral seas have already done (discussed here).
None of this work involved any programming, the data used is available on this page, everything else has been done in a spreadsheet. Hint - anyone can dig into this data...


No comments:
Post a Comment