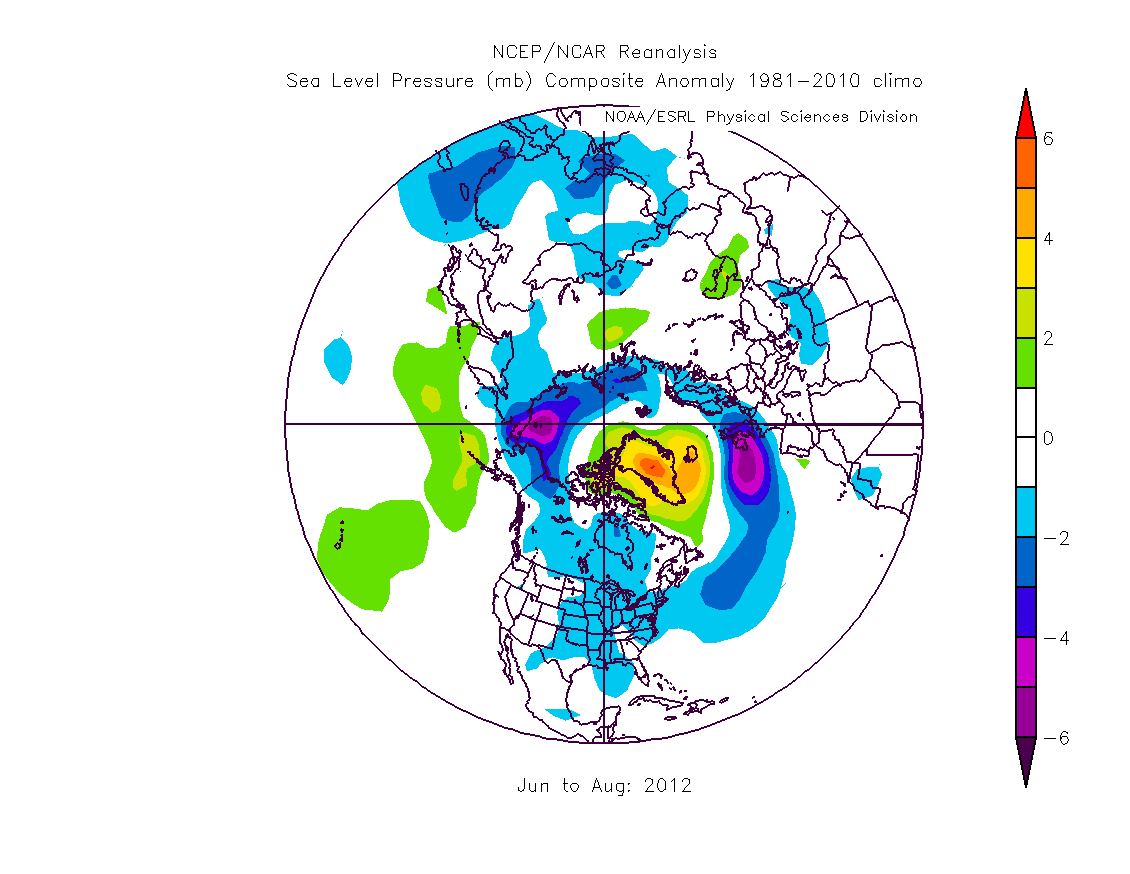
I've blogged previously in a series of posts under the general title of Summer Daze about a new pattern of atmospheric circulation in the northern hemisphere post 2007. The pattern is most readily seen in the anomaly of sea level pressure (SLP) average for June, July and August (JJA) from 2007 to 2012.

Late this summer I used gridded NCEP/NCAR SLP data for JJA to calculate the correlation with the above pattern for each summer month from 1979 to 2013.
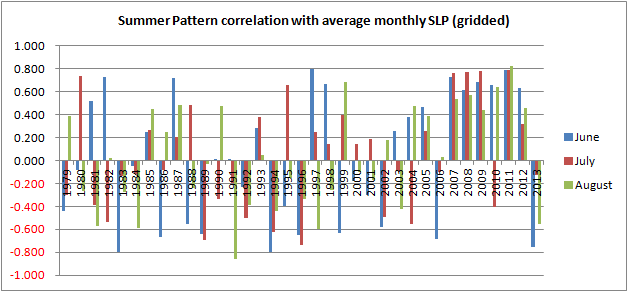
This clearly shows the unique behaviour for 2007 to 2012 after 1979, although I have used a different method to look for the pattern in data going back to 1948, link, confirming its uniqueness since then in terms of 5 year averages. The pattern correlation above can be calculated using the JJA average pressure and is shown below, with red bars indicating the Arctic Oscillation (AO) Index.
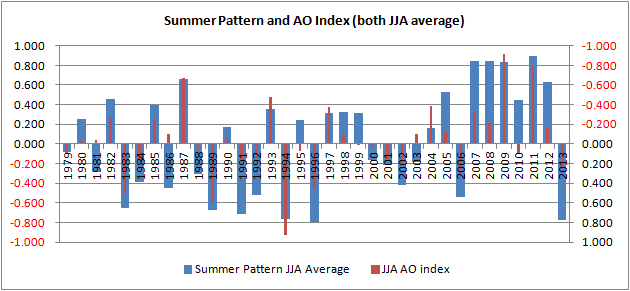
The agreement between the AO Index and the summer pattern (correlation -0.816) is high, this is to be expected given that pressure over the Arctic Ocean is a key component in both indices.
I've previously written on the link between Eurasian snow cover and a high pressure in May over Siberia, here. The high pressure can be seen (upper left quarter) in the difference between average 500mb geopotential height (GPH) for 2007 to 2012 and the preceding thirty year period. I have been unable to update this to include 2013 due to the US Government (if indeed they have one in all but name) shutdown, but one year won't change the result much.
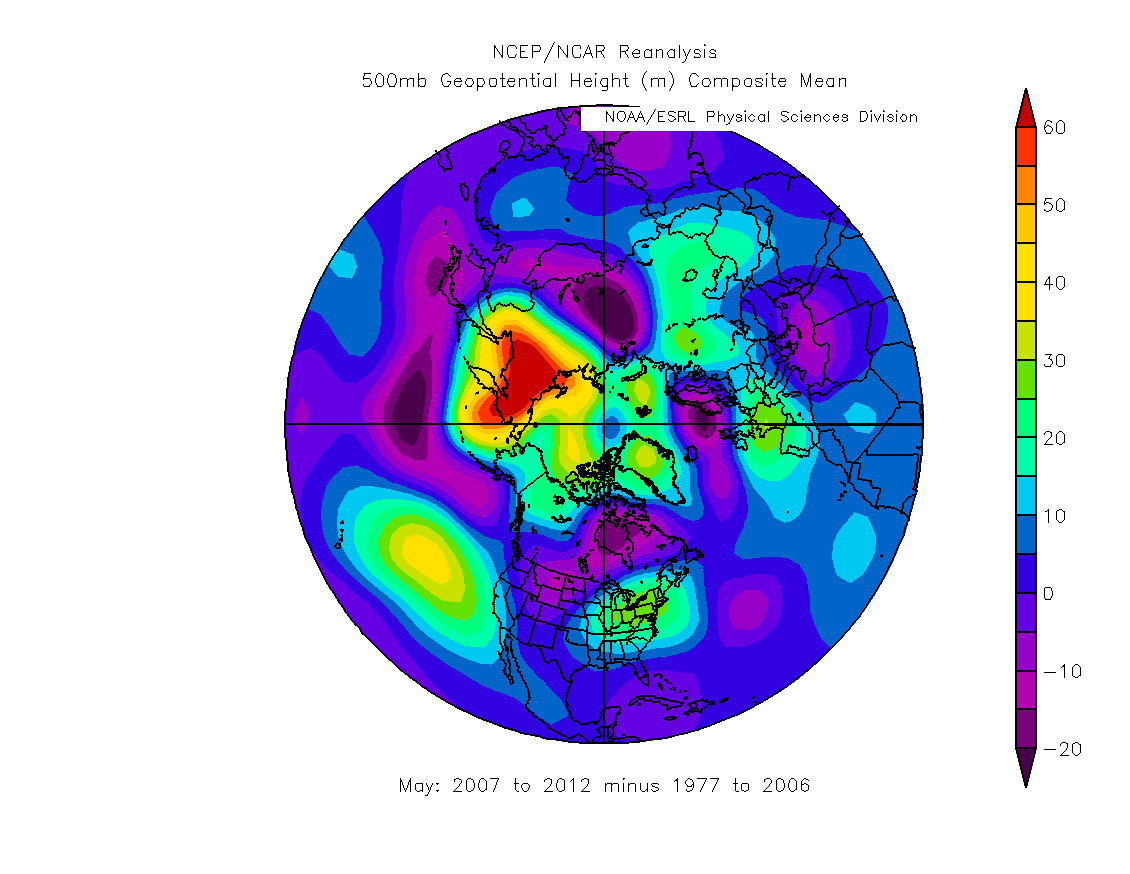
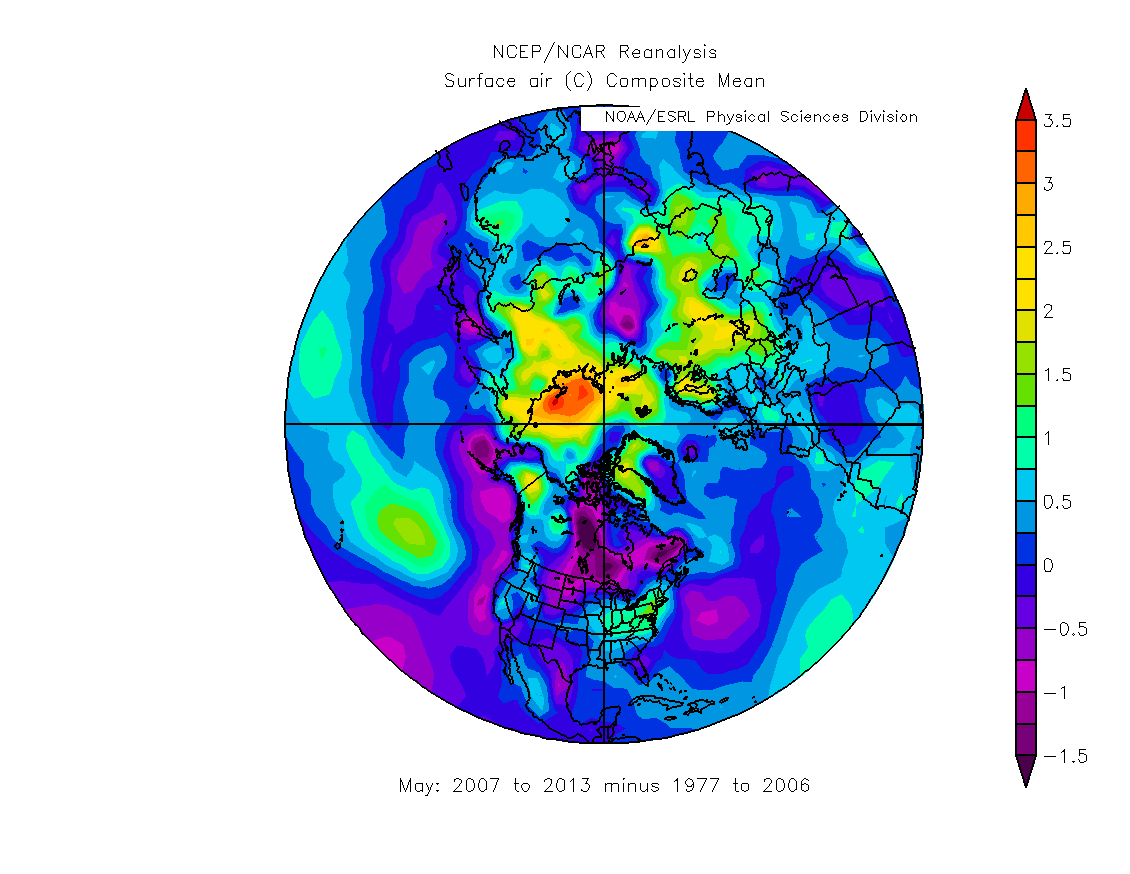
This is the region of warming that seems to be from early retreat of the snowline, and the warming seems to be driving the increase in GPH. Note that the warming and retreat of snowline is not likely to be a one way effect, more a positive feedback, whereby initially warmer temperatures lead to loss of snow which exposes darker surface and leads to more warming due to decreased albedo which in turn favours more snow loss.
GPH in a box within the region is seen to be increasing in recent years.

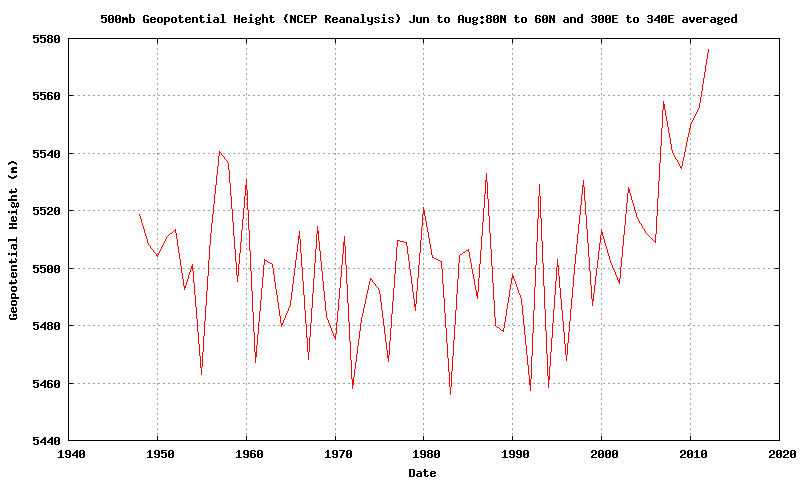
However GPH has generally been increasing over the northern hemisphere, as shown in the graphic below calculated from NCEP/NCAR data.

I have adjusted the Siberian May GPH and Greenland JJA GPH by subtracting that general increase in northern hemisphere GPH from the timeseries for those regions, using anomalies from the 1981 to 2010 baseline. The result shows that both exhibit anomalous increases in atmospheric height at the 500mb level with respect to the period from 1948 to date.
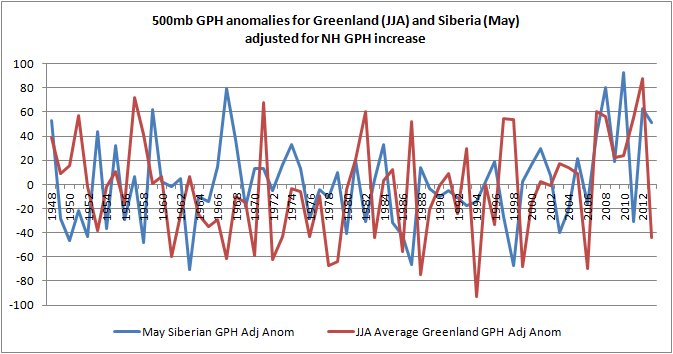
There are years with as great an anomaly, but the post 2007 years stand out as simultaneously showing high GPH for a prolonged period. However the relationship between the two is far from clear, whilst one may argue that 2013 is an anomalous year for the summer pattern and its central Greenland GPH ridge, thus suggesting the May Siberian GPH ridge could still be causal, 2011 had a negative anomaly of GPH suggesting that the high Greenland GPH anomaly in the following summer was unrelated. This may simply be an artefact of the region I have chosen to 'box' to calculate the May GPH for Siberia, because in that year the region concerned was between a trough in the north Pacific and a ridge landward of the Tamyr Peninsular. A similar effect could be argued for 2009. I've uploaded a folder of plots for recent years here, so you can judge for yourself.
4 comments:
Thanks Chris,
I find the work you've been doing on the graphs and maps impressive and inspiring.
What the significance of the rising GPH levels is, would be very interesting. I see your graph as a confirmation that something is going on...
Werther
Hi Werther,
The NH average rising of the atmosphere is due to warming. Warmer air expands and pushes the level at which the 500mb layer is found upwards. The 500mb layer is found at about 5700m on average and that has risen by around 15m, so the effect is small.
Chris, you might find some useful data in this paper.
Abstract
Empirical orthogonal function (EOF) analysis is performed on the field of the northern hemisphere geopotential height at 200-hPa using a 54-year (1958–2011) record of summer data on an interdecadal time scale. The first dominant mode, which shows smooth semi-hemispheric variation with maximum action centers in the western hemisphere in the mid-latitudes over the eastern Pacific, North America, and the North Atlantic, is related to global warming. The second mode, which has a pronounced tropical-extratropical alternating pattern with active centers located over the eastern hemisphere from Western Europe across East Asia to the western Pacific, has a close relationship with the Arctic Oscillation. Further analysis results indicate that the two dominant modes show good correlation with the Arctic sea ice concentration (SIC), with correlation coefficients between these two modes and the first two EOF modes of the Arctic SIC reaching 0.88 and 0.86, respectively.
Dominant modes of geopotential height in the northern hemisphere in summer on interdecadal timescales
Interesting that though their data is for 200hPa, they came up with the same correlation coefficients :)
Kevin,
Thanks for that paper, very interesting. I'll have a dig around for a paywall free copy - not much chance of that though to be frank.
Post a Comment