I didn't pursue it last year, but as will be seen I should have done, it would have been successful once more.
The method I will use from now on is roughly the same as in 2013, but I will use the entire range between the upper and lower bounds. Here's how the method works.
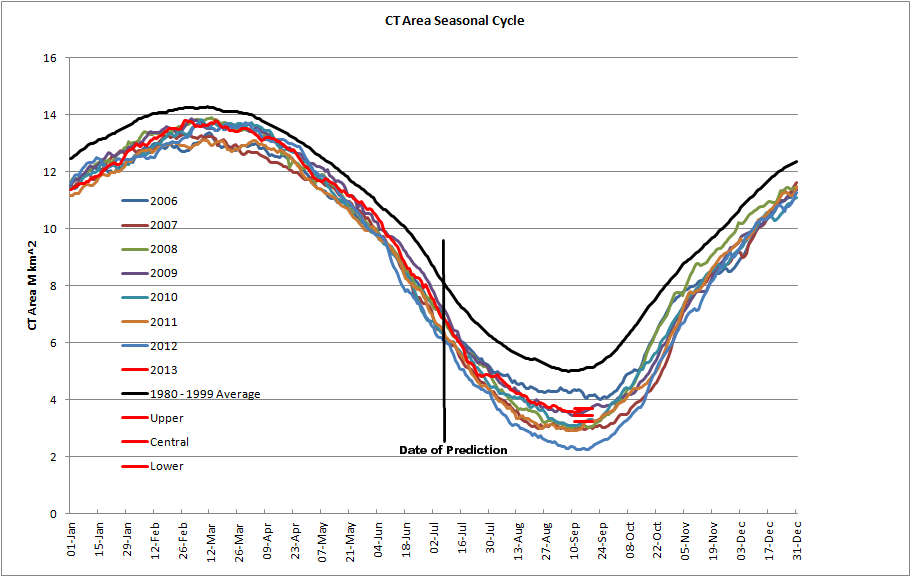
I had noticed that the slope of losses through the summer dropped to zero by late June. In the following graphic, I have calculated the area losses for each day to the minimum area for all years 1979 to 2014. So for example, for 20 June I calculate the losses from 20 June to the minimum for each year. That gives me a series of 36 numbers, summer losses for each year. I have then calculated the slope of a line from those numbers, the average and the standard deviation.
So here are the slopes of the differences between each day of the year and the minimum for each year.

The key thing is that the slope drops to near zero in late June. Simply put, there is little trend in late summer losses in CT Area.
So let's zoom-in on late June.

Here I have included the standard deviation (sigma) as well as the slope. I want to choose the earliest date with a low slope (no trend in summer losses), and at the same time aim for the standard deviation being low because that tightens the bounds of my prediction.
I settled upon 23 June as the best trade off between standard deviation an slope. So I know that for the 23 June over the period 1979 to 2014 there is little change in summer losses, and the scatter (standard deviation) caused by factors like weather is minimised. I have also calculated the average losses.
The statistical model used to make predictions is very simple.
- Take the CT Area on 23 June.
- Subtract from that area the average losses to minimum for 23 June, which gives the central value of the prediction.
- Apply the bounds of the prediction by adding (upper bound), or subtracting (lower bound), the standard deviation. See paragraph below.
However I don't just use the standard deviation, I use the standard deviation multiplied by a number I call the Sigma Multiplier. By varying the sigma multiplier I can change how successful the hindcast is, trading off success rate against how wide the range of prediction for each year is. I chose a sigma multiplier of 1.2, giving a success rate of 81%, with a reasonable range of 0.74M km^2 (for context the difference between the lowest and highest CT Area minimum for 2007 to 2014 was 1.2M km^2).
So here is a plot of the hindcasts from 1979 to 2014. Lower is the lower bound, Upper the upper bound and Central is the central prediction. The actual minimum area on the day of minimum is shown as Actual (black line).

The choice of sigma multiplier seems reasonable, where the hindcast fails it fails by a small margin, yet the decline of area, and peaks and troughs of the decline are reflected in the hindcast of the statistical model.
I didn't do this prediction last year, but the hindcast shows that 2014, like 2013, was bang on.
When CT Area data is available for 23 June 2015 I will post with the CT Area prediction for this year. It will be too late for my June Sea Ice Prediction Network (SIPN) prediction (which I will discuss next), but it will be one of the factors I will use to guide my July SIPN prediction.
2 comments:
Chris, by your method I come up with a better and earlier day of year for prediction. The first prediction is in year 1980 and the most recent is 2014. Comparing the prediction to the actual minimum I find:
DoY..... SDEV .. Max Neg .Max Pos
161 0.41257 -0.72513 1.09899
162 0.40311 -0.61513 0.93488
163 0.37538 -0.59343 0.83696
164 0.36508 -0.60347 0.77775
165 0.36485 -0.61313 0.71999
166 0.35234 -0.55140 0.68374
167 0.33909 -0.54953 0.59384
168 0.34550 -0.62469 0.61667
169 0.33609 -0.65820 0.56331
170 0.35054 -0.73710 0.58745
171 0.34377 -0.66696 0.60714
172 0.34373 -0.65729 0.70743
173 0.34527 -0.67165 0.67598
174 0.35498 -0.75354 0.65309
175 0.36591 -0.80149 0.73977
176 0.38177 -0.81704 0.82748
177 0.38287 -0.79687 0.79497
178 0.37954 -0.82407 0.71205
179 0.39404 -0.83418 0.67331
180 0.39778 -0.82608 0.69899
181 0.40710 -0.82770 0.67566
Looking at these same results, but only the last 10 years worth of predictions, I find:
DoY..... SDEV .. Max Neg .Max Pos
161 0.40343 -0.29886 1.09899
162 0.39314 -0.40438 0.93488
163 0.40827 -0.48347 0.83696
164 0.40433 -0.50826 0.77775
165 0.37399 -0.43828 0.71999
166 0.37871 -0.55140 0.68374
167 0.35573 -0.54953 0.59384
168 0.37947 -0.62469 0.61667
169 0.36947 -0.61261 0.56331
170 0.40942 -0.73710 0.58745
171 0.40052 -0.66696 0.60087
172 0.39655 -0.59286 0.65347
173 0.38409 -0.57370 0.61336
174 0.38653 -0.53968 0.62792
175 0.40071 -0.53685 0.64727
176 0.43414 -0.50716 0.68240
177 0.44381 -0.54176 0.68402
178 0.44647 -0.57714 0.63750
179 0.43147 -0.60233 0.61999
180 0.42879 -0.57391 0.61829
181 0.43424 -0.53169 0.67566
Day 167 has both the smallest SDEV and the smallest error band for both the entire record and the last 10 predictions. (I'm using 'error band' here to represent the delta between the largest positive and largest negative deviations.)
But basically any day around the summer solstice is going to give you very similar numbers.
Kevin,
There is wiggle room, if you want to pursue using an earlier date feel free.
If I take the area or extent in both 1979 and 2012 (high end and low end of area or extent at minimum). And I take the range of the predictions for CT Area and NSIDC extent (on which I will blog this week)...
For (Min Extent or Area) / Range
Using June data for both CT Area and NSIDC Extent I get...
CT Area 1979 7.2
CT Area 2012 3.0
NSIDC Extent 1979 6.5
NSIDC Extent 2012 3.3
This index should be larger for a better quality of prediction, narrow range compared to the overall level. Comparing like for like both indices give similar performance for a similar lead time. April data gives:
NSIDC Extent 1979 5.6
NSIDC Extent 2012 2.8
I might use May data for my NSIDC prediction...
Post a Comment