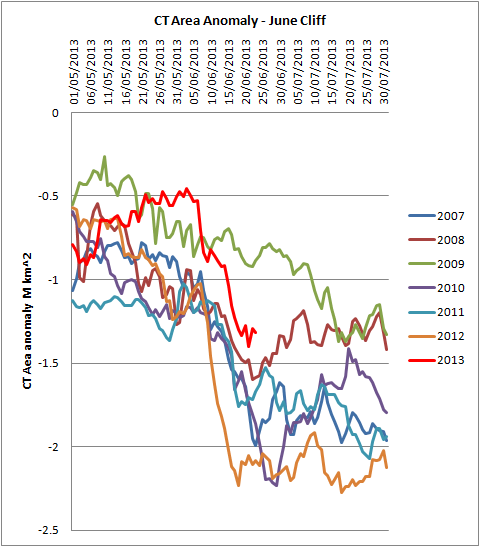
2013 joins 2007, 2010, 2011 and 2012 in having a June Cliff. I'm pretty sure that 2013's June Cliff has now ended, it lasted from 6 June to 18 June. My next post on the Arctic sea ice will be the June Status post, when the PIOMAS data is out, this post will not be updated further.
As mentioned in my previous post, and discussed in the earlier post on the June Cliff (Crash) much of this drop in CT Area is not real loss of area but is due to melt ponding on the ice. This does not mean it has no impact on real area because melt ponds lower the albedo of the surface and absorb more sunlight.
While I now doubt we will see a new record this year, I expect a very exciting season. As with the May Status posts, I expect the June Status to take up more than one post.
Data as of 23/6/13.
Date Area Daily Difference
01/6 10.656 -0.035 0.716
02/6 10.581 -0.075 0.703
03/6 10.498 -0.084 0.715
04/6 10.382 -0.116 0.601
05/6 10.291 -0.091 0.535
06/6 10.223 -0.068 0.505
07/6 09.976 -0.247 0.314
08/6 09.815 -0.161 0.301
09/6 09.710 -0.105 0.369
10/6 09.714 +0.004 0.639
11/6 09.617 -0.097 0.775
12/6 09.535 -0.081 0.851
13/6 09.452 -0.083 0.898
14/6 09.384 -0.068 0.974
15/6 09.191 -0.193 0.987
16/6 08.992 -0.199 0.962
17/6 08.865 -0.127 0.918
18/6 08.722 -0.143 0.933
19/6 08.595 -0.127 0.749
20/6 08.597 +0.002 0.826
21/6 08.389 -0.208 0.651
22/6 08.403 +0.014 0.816
23/6 08.272 -0.131 0.768
Source data from Cryosphere Today, link.
13 comments:
A significant portion of this drop is due to the onset of the effect of the bias error in the measurement methods. Treating fast ice that has turned blue due to some surface melting of the overlaying snow as an abrupt change to 60% coverage, when in fact it remains 100%, inflates the reported rate of change to the ice area and fabricates a "cliff" in the data. The shadows of clouds over the central arctic have a similar effect, making 80-90% ice coverage look like regions of 60% coverage.
It just the time of year the bias errors are most pronounced.
Thanks Anon,
As stated in my earlier post on this subject (link at start of this post), this is pretty much the conclusion I'd been drawn to. Although you've added more detail, for which I'm grateful.
What base period do you use for calculating the anomalies in your graph? I know you have posted it before, but I cannot seem to find it. I ask because they do not match the anomalies given by CT in the source link you gave.
Anon,
I use 1980 to 1999, for both area and volume anomalies.
Chris, I'm of the opinion that the steepest portions of the cliff are due to melt-ponding. 2013 saw a late start to the melt-pond season, so being behind at the moment makes sense. If you look at CT area daily numbers versus yearly minimum, the correlation coefficients drop into a notch from mid-June to mid-July. I attribute this to 'false' area losses being recorded due to melt ponds.
Also interesting is that the high melt years (as you noted - 2007,2010,2011, & 2012) all crossed the CT area 6 Mkm^2 mark on day 191 plus or minus a day.
Kevin,
Then we're of the same opinion.
As for why a large drop might be associated with a lower area at minimum, I think the melt ponds precondition the ice for more melt.
I've not done a daily correlation, just monthly, thanks for pointing out that finding.
Chris,
Yes, the high melt pond fraction may lead to temporarily misleading area/extent numbers, but it's indicative of increased warming in general, heightens the albedo feedback and as you say helps precondition the ice for actual area/extent losses.
The melt pond fraction effect on area seems to self-correct by mid-July. I'll be watching closely to see if 2013 can hit that 6 Mkm CT area mark by day 191. If it does, then I expect a new record. If not, then we may see a slight rebound. Still, the difference between the individual 'melt out years' isn't really significant on CT daily area numbers until after August 1st.
Day 191 = 10/7/13.
I've recently been saying I think we won't beat 2012 but probably will beat 2007 this year. IN early July I'll decide whether to formally raise my prediction of 1.75 to 2M km^2 CT Area made earlier this year.
With regards day 191:
Difference between average areas for days 191 (10/7) and 169 (18/6) is a loss of -2.262M km^2. Apply that to 8.722M (area at day 169) and that gives area at day 191 of 6.460M. But that's a high-end estimate as losses over that period are increasing.
Going below 6M km^2 by 191 is feasible. It's worth noting that both 2011 and 2012 did so. Yet 2011 started from 8.261M and 2012 from 7.790M.
At present I am really unsure what will happen, a reduction of losses is possible, but equally given the state of the pack, record losses are possible.
Kevin,
Hope you don't mind, but I've relayed some of your comments over at the forum. Link.
these area measurements, are they modulated by the %ice-in-cell measurement, or are they just 1 if >15%, and 0 otherwise?
Andy,
Area is the percentage of ice in a cell, that's what is show here. Extent is the total area of cells for which the percentage concentration is over 15%. I don't use extent data.
Chris,
The DMI north of 80 temp reanalysis has never been of much use during the peak summer months - no variation because the temps are constrained by the freezing point of water - fresh water.
I've been looking at those below normal temps for a few weeks now wondering just what in the world is going on - temps do not just mimic the previous curve albeit a degree or 2 colder.
It almost looks like the temps are now constrained by the freezing point of water - salt water.
Kevin,
I think this is just a coincidence. As you'll see in my June update blog post, on which I a working; the atmospheric set up this year is radically different from any post 2007 year. That is what has made things cooler IMO.
Post a Comment