But is there a role for snow cover changes in driving this new pattern, and if so what is it?
I really need to call this pattern something, so have decided on the Greenland Centred Summer Circulation Pattern (GCSCP), which will do until proper scientists get to grips with it. As part of what I've been looking at I've been looking at the suggestion by Overland et al that snow cover anomalies in spring may be playing a role. I've used snow cover data from Rutger's Snowlab, and NCEP/NCAR data.
North American snow cover shows decline in June and July post 2007, June being a very strong decline.
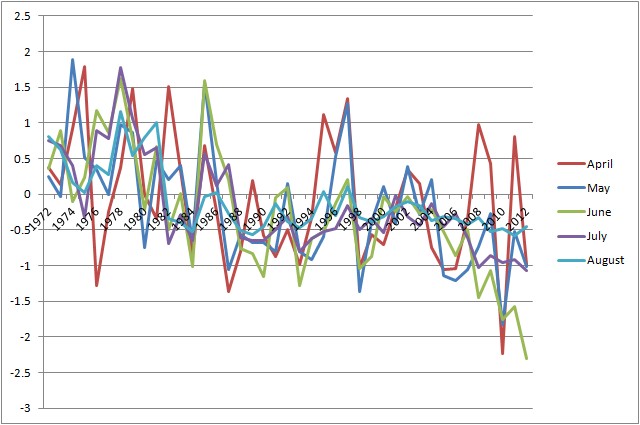
Fig 1, Anomalies of snow extent from Rutger's Snowlab for North America.
In Eurasia there is a strong decline in May and June, with July and August being low due to lower absolute areas of snow.
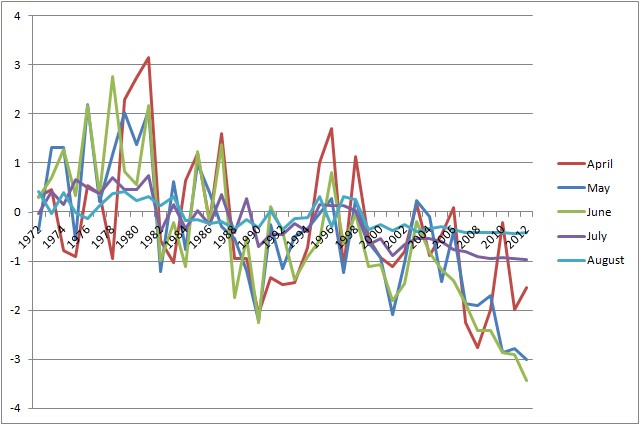
Fig 1, Anomalies of snow extent from Rutger's Snowlab for Eurasia.
So it is feasible that the new circulation could be due to the decline of snow. For some time I focussed on Eurasian snow, this is partly because there's extensive literature on it, partly because North American snow cover is not showing such a strong pattern of change as Eurasia, despite the total anomalies. However it might be worth trying to parallel this analysis with a similar approach to North America. That said, for now I'll concentrate on Eurasia.
For information, here are the snow extent anomalies for May 1992 to 2012, browns are a negative anomaly (less than average), blues are positive anomalies.

Fig 2, May snow cover anomaly plots from Rutger's snow lab.
The recent loss of snow cover is notable over a broad swathe of Eurasia, this is approximately shown in the Google Earth image below, I refer to this as the Eurasian snow box.
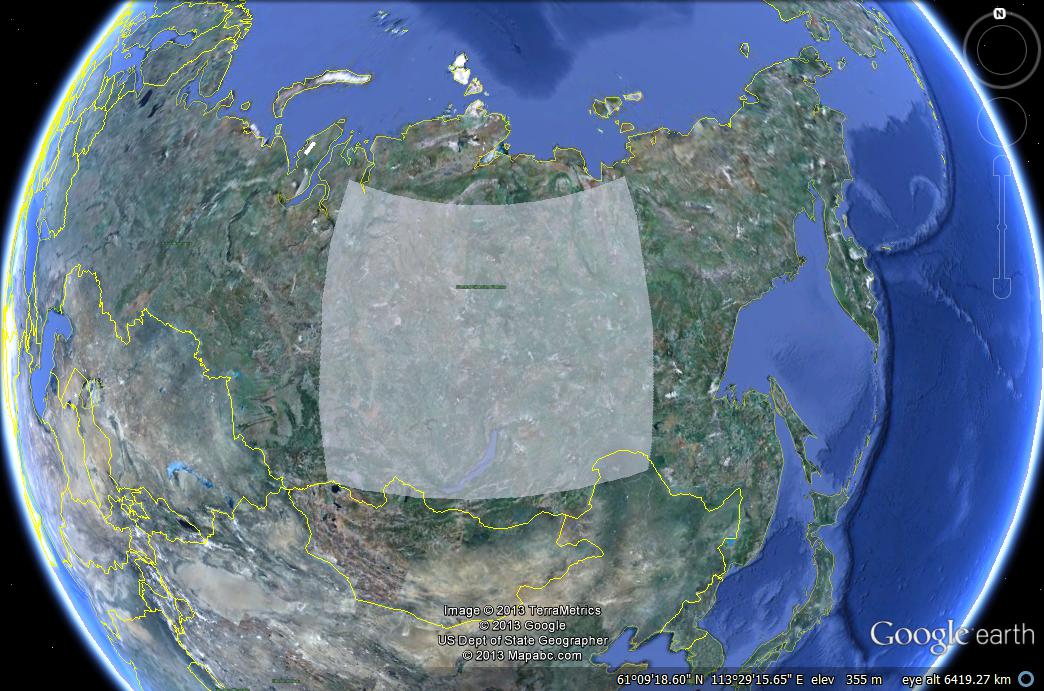
Fig 3, Eurasian snow box area, roughly the same area as used in figure 4.

The temperatures in this region have risen from 1960 to 1990, then levelled, with a suggestion of a recent post 2007 temperature rise. So I have restricted the following analysis to post 1990 because it's not possible for me to de-trend using the NCEP/NCAR system, unless I download the gridded data and I balk at the hours I'd need to invest in that.
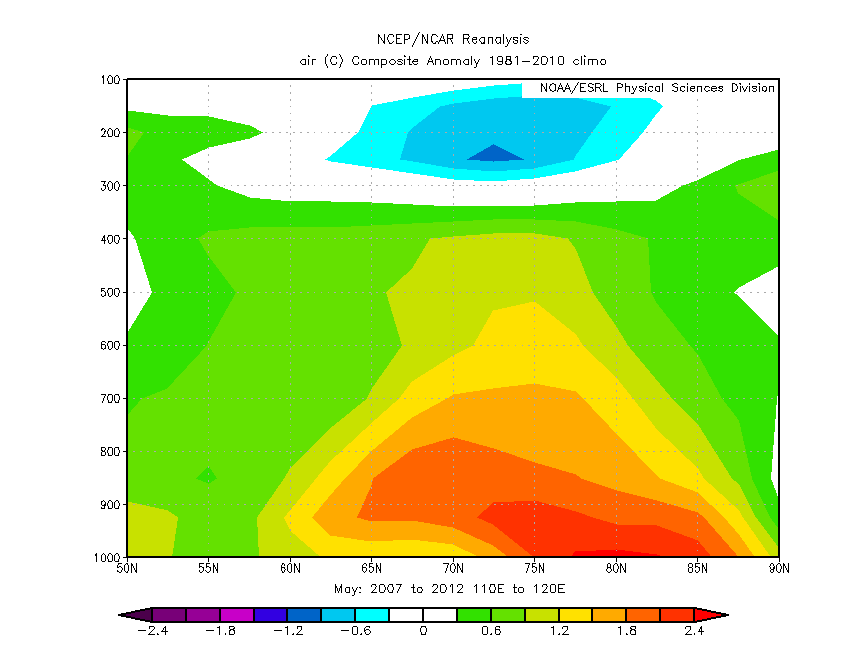
First I've taken the post 2007 years, considering May because this is the earliest period of rapid decline of snow extent in Eurasia.

It can be seen that along with the substantial warming over the Siberian coast of the Arctic Ocean there is a warming across the land, in roughly the same area as the greatest decline of snow extent. The warming across the Siberian coast is due to thinner ice following 2007, as I will argue below. However the region of land warming is coincident with the area of reduced snow cover.

During years with low snow cover anomalies in the region of the Eurasian snow box a low temperature anomaly is seen in the region of the snow box. While the Arctic Ocean is warm, albeit not as warm as the post 2007 period because the ice is thicker. It is however worth noting that the warm anomalies within the Arctic ocean are ranged around the periphery, where ice would be thinner.
Crucial to understanding what is going on is to look at what is happening in terms of height, not just spatially as above. To do this I have taken a cross section over the region but have extended this poleward to the pole itself, I've selected 110 to 120 degrees as the section, as this runs through the middle of the snow box.
Firstly here is the cross section for years 2007 to 2012.
Here it can be seen that in the post 2007 years (years of lower snow extent) there seems to be large warming of the Arctic Ocean, which is from the surface, presumably due to increased heat flux from the ocean due to thinner ice, i.e. the low level warming is indicative of a low level source of energy in the Arctic Ocean, that this reduces closer to the pole where the ice is thicker seems to me to support this interpretation. And this warming over the ocean seems to impinge over the land.
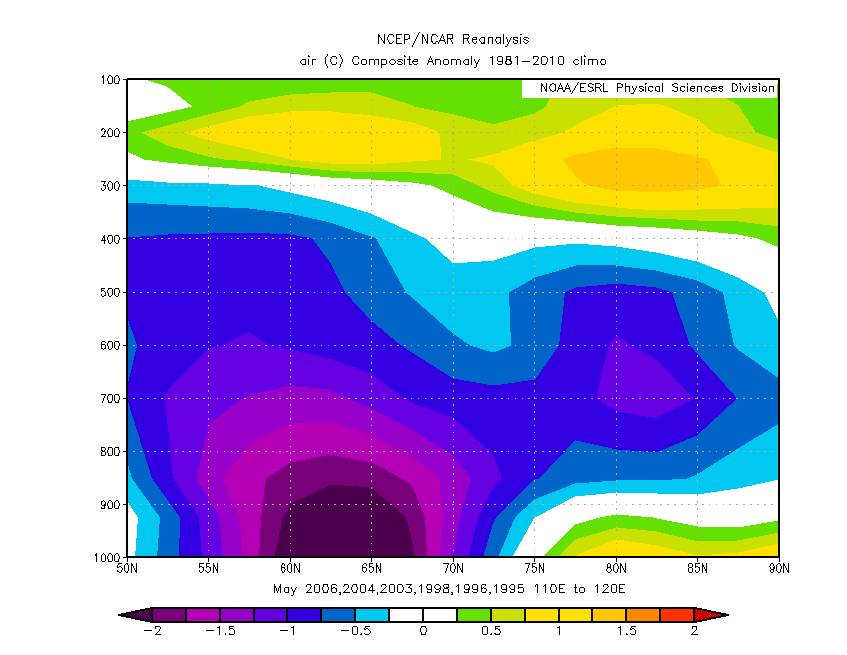
Fig 8, NCEP/NCAR cross section from the pole across the Eurasion snow box, for years 2006, 2004, 2003, 1998, 1996, 1995, years with high May snow anomalies.
In years with a high snow anomaly (larger snow extent) there is a surface based cold-anomaly, which presumable is due to surface cooling due to the snow albedo effect - snow reflecting sunlight back to space and cooling the ground.
So why don't we see the same ground effect in the case of less snow? This might be because the anomaly period is 1981 to 2010, so the anomaly period covers 20 years (since the 1990s) of lower than average snow extent (fig 1). In the case of more snow conditions are getting closer to the state before the 1990s, so the ground based anomaly stands out clearly. In contrast the mean temperature field shows a low level warming, ref, so in the process of generating the anomaly, the subtraction of this profile generates a lifted warming profile.
So I think it is reasonable to conclude that lower extents of snow cause a warming at the surface, while higher extents of snow cool the surface, as one would expect.
There is extensive literature on the connection between Eurasian snow cover and impacts on the atmosphere, e.g. Google. It is possible that the North American snow cover is having an effect on the GCSCP, but let's just follow the Eurasian route for a while longer.
The following images are using the same sets of years as figures 5 and 6, but instead show geopotential heights (GPHs). These are the differences of mean height at which pressure of 500mb is found.

Fig 10, Geopotential Height (NCEP/NCAR) for May 2006, 2004, 2003, 1998, 1996, 1995, years of high snow extent in the Eurasian snow box.
Figures 9 and 10 show that during lower extents of snow cover in May the GPHs are higher, while during higher extents of snow cover in May GPH is lower. This is significant because of the track of the Jetstream, which covers the region of the Eurasian snow box. It is feasible that the GPH impacts of snow cover recession are having knock on effects on phase or wavenumber of Rossby waves in the Jetstream that then give rise to the Greenland GPH ridge at the centre of the GCSCP. With regards waves, I also find the pattern of lows around the Greenland high post 2007 to be very intriguing, I keep pondering if this is due to waves in the atmosphere.
Fig 10, The Greenland Centred Summer Circulation Pattern (GCSCP) showing the halo of low pressure tendency around the central Greenland high.
However I still can't help but wonder if more direct changes in the sea ice, giving rise to increased heat fluxes over the Arctic, and earlier more extensive open water from Beaufort to Barents, are driving the Greenland GPH ridge and consequent GCSCP. And I'm still intrigued by Wayne Davidson's suggestion that this summer pattern is as a result of the cold polar centre moving to Greenland, despite some of the issues I see with that view.
4 comments:
>"So I think it is reasonable to conclude that lower extents of snow cause a warming at the surface, while higher extents of snow cool the surface, as one would expect."
Yes that is what I would expect to be the direction of causation. To some extent there may also be causation the other way: higher temps cause less snow?
>"The warming across the Siberian coast is due to thinner ice following 2007, as I will argue below. However the region of land warming is coincident with the area of reduced sea ice."
I doubt you meant land and sea are in the same place so I suspect the 'sea ice' at the end should be snow cover and perhaps add 'sea' before ice in the first sentence quoted.
Thanks for finding that mistake.
Yes I think the warming caused by less snow cover is a feedback, amplifying the effects of a pre-existing warming. Although figures 7 and 5 seem suggestive of a role for Arctic sea ice loss - against which I should add that any influx of moisture from the Arctic is likely to be moist, so if it's cold enough that would imply more snow. May average temperatures for 2007 to 2012 are around 0 to 5 degrees.
The main issue with the snow from what I've read is earlier melt. NCEP/NCAR shows no recent change in precipitation in May, I've not posted that because I'm not sure about the reliability of NCEP/NCAR precipitation. But that's not the issue, what's at issue is the early melt of snow accumulated over the winter, which reasonably can be expected to result in surface warming, and does seem to be doing so.
Ye & Cohen's paper on snow season length is worth reading on this matter. Dr Ye's video on that page is also worth watching.
http://iopscience.iop.org/1748-9326/8/1/014052
Maslanik's DAM map page has now updated through week 13 of 2013!!!!
Thanks Nightvid, I've been wondering when that would happen.
Post a Comment