First, key to understanding the cause is to understand the process, as far as it is understood at present. It's been suggested by several people that this change is because the centre of atmospheric circulation has shifted to Greenland. I've been dismissive of one explanation, that the centre of high pressure has moved to the Greenland ice sheet as the nearest available patch of cold air over ice. But the idea of the centre of action shifting to Greenland is one I'm starting to have sympathy with.
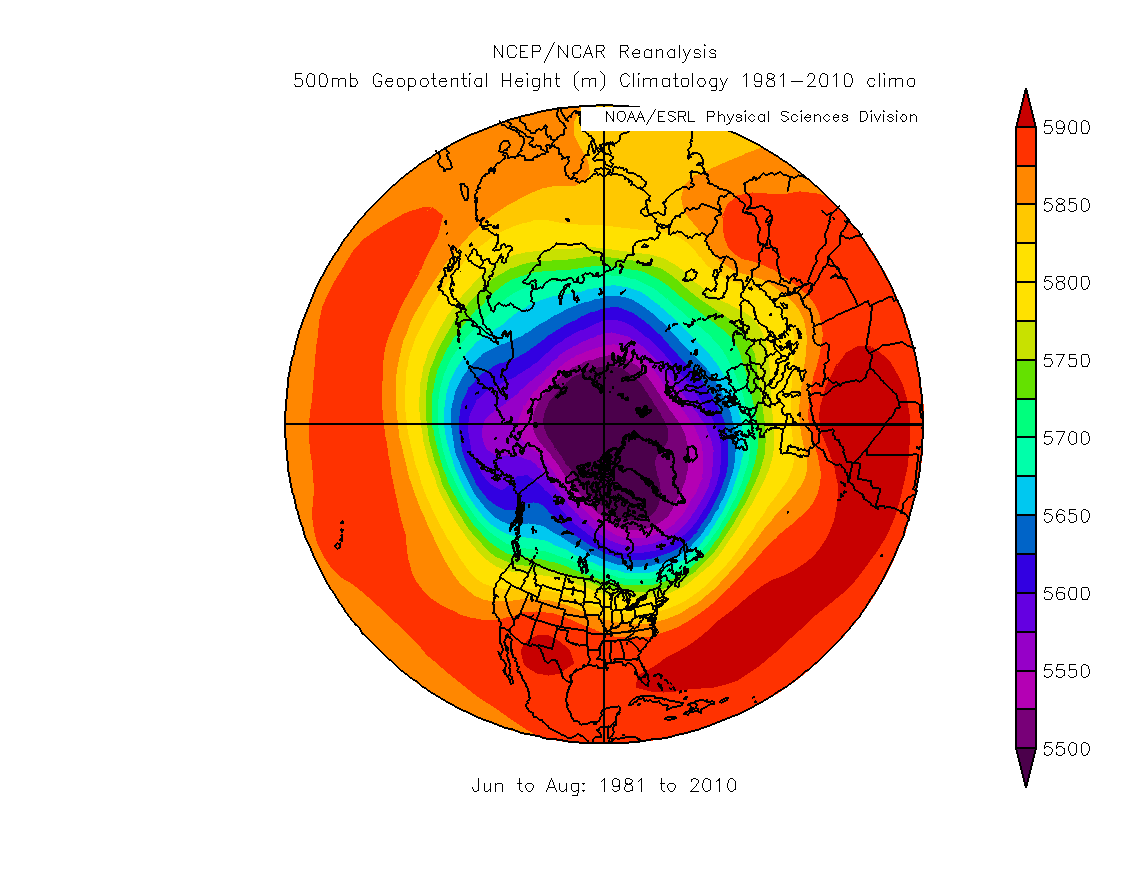
Here is an NCEP/NCAR plot (source) of the baseline mean geopotential height (GPH) for 500mb pressure (1981 to 2010).

Switching back to the sea level pressure pattern view and I can see some reason for sympathy with the idea of a new centre of action centred over Greenland. This is because Greenland can be seen as the centre of clockwise airflow driven by the Greenland high (clockwise air movement of air) and surrounding lows (anticlockwise movement of air). Thus creating a net clockwise flow around Greenland.
The question is, what is causing the Greenland ridge and associated high pressure? Both Hanna et al and Overland et al offer reasonable explanations giving avenues for further research.
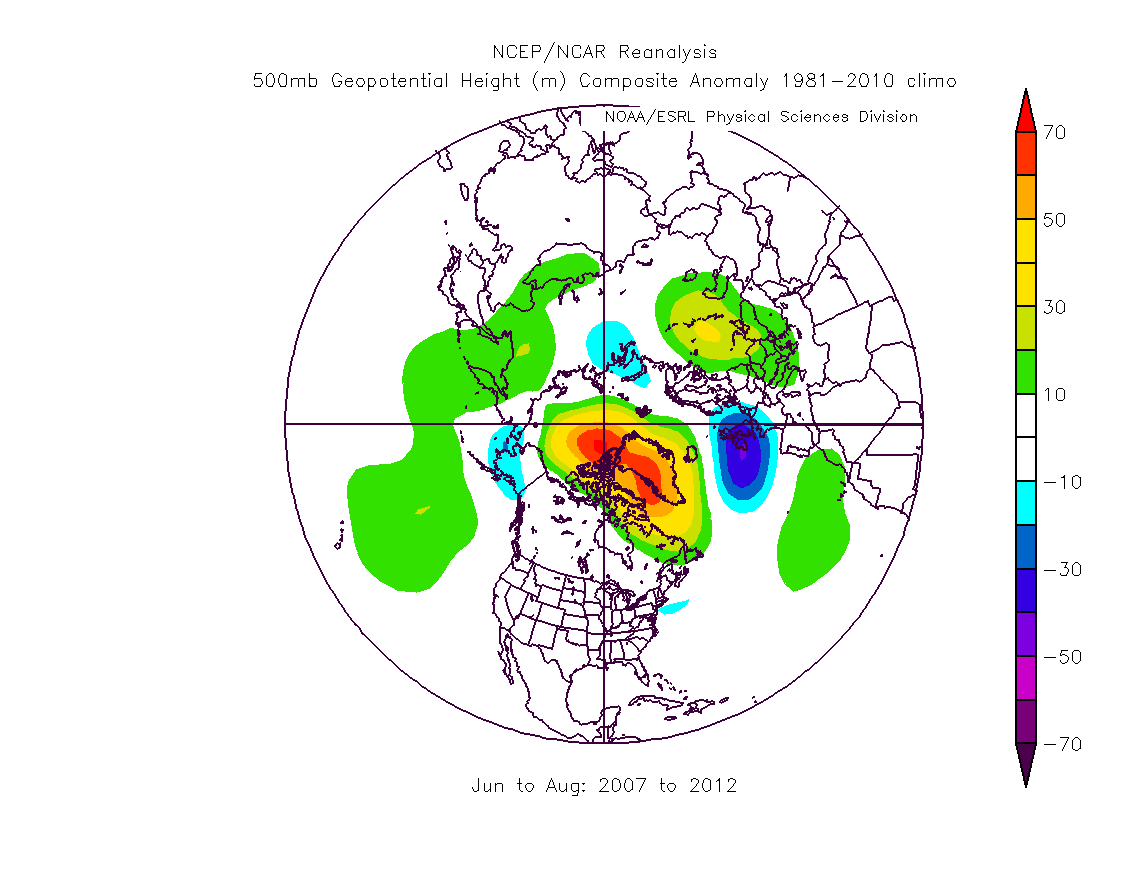
Hanna et al offer an intriguing suggestion based on waves in the atmosphere relating to the Greenland high pressure at the centre of the pattern. People are most familiar with waves on water, in that case what is going on is a battle between the water 'wanting' to settle down to a level and the dissipation of energy put into it by, most commonly, the wind. The restoring force that seeks to get water level is gravity. In the atmosphere the restoring force is the coriolis force, which is due to the spin of the Earth, and as opposed to water, where the waves are vertical, in the atmosphere the waves I'm concerned with are horizontal, they're called Rossby waves. These waves circle the Earth and are most commonly seen in the twists and turns of the Jetstream, the boundary between cold Arctic and warm sub tropical air. They can be seen in the irregular shape described by the blue region (5600m GPH) in the top two graphics. The peaks create bumps away from the centre.
As the waves circle the Earth they have various frequency components, what Hanna et al concern themselves with is the dominant wavelength. They find that summers with highest GBI (Greenland Blocking Index) have a 4 wave pattern, and summers with lowest GBI have a 3 wave pattern. A 4 wave pattern leads to slower zonal flow (air flow around the pole at mid latitudes) leading to increased tendency for blocking, whereas a 3 wave pattern gives faster zonal flow reducing the tendency for blocking. Crucially waves offer one mechanism by which changes in one part of the northern hemisphere can connect to other parts of the northern hemisphere.
Overland et al propose that there may be a role for snow cover anomalies in creating the blocking high over Greenland.
Firstly it's important to note that Overland et al look at June 700hPa geopotential heights, June being the start of the pattern, and show that the pressure difference leading to the AD after 2007 is due to the Greenland/CAA blocking, with the Siberian sector showing little or no consistent features. This is borne out by my initial Summer Daze post where it is seen that whilst in the average the 'halo' of low pressures appear, the consistent interannual feature is the high over Greenland, which spreads to the CAA in many years. The low pressures ranged around the eastern Arctic have no consistent year to year pattern, although on the long term average they appear as part of a halo of low pressure around the Greenland high.
Snow cover data is available from Rutger's Snowlab. The anomalies for North America show low anomalies from May onwards, from 2005, ref, however the spatial pattern of anomalies is markedly different in North America, ref. Zhang found the AD to have become more active since 2003 to 2008, Overland has previously found the AD to have become more active after around 2005. So the North America snow cover anomalies are suggestive in this respect. However this leaves the question; why was it only after 2007's sea-ice crash that the Greenland blocking became such a strong feature? Eurasian snow cover anomalies might offer a way out of that problem. In Eurasia's April snow cover anomalies the low anomalies start from 2007, and 2010 is a year with low anomalies, ref, which could be of interest because as I showed in the original Summer Daze post, the Greenland centred pattern was less pronounced in 2010. Hanna et al found 2010s GBI to be the highest in the time period considered, this difference is because in my previous posts I've used sea level pressure to spot the pattern, whereas the GBI is defined as the mean 500hPa GPH over a specified grid area containing Greenland.
So if snow cover changes in April, May or June, are responsible for initiating the Greenland blocking pattern; what carries the signal onwards into the summer making this a semi-permanent feature in June to August of 2007 to 2011? I have wondered about a paper entitled "Atmospheric response to the extreme Arctic sea ice conditions in 2007" by Bluthgen et al. I'm not the only one, in the comments on the previous posts Marsanges has too. Bluthgen et al uses a GCM to examine the progression of the summer of 2007, they find that the initial low pressure over the Siberian sector of the Arctic is then contributed to by the strong retreat of sea-ice that the AD event of that year initiates, a positive feedback. Has this happened in other recent years? I don't know. But it's a intriguing line to follow.
One implication of Overland et al is the role of the AD and atmospheric impacts on the post 2007 behaviour of the Arctic ice pack. I had previously thought that almost all of the change in behaviours such as annual cycle was due to ice processes, with wind forcing playing a significant but not key role. However Overland et al implicitly stresses the importance of the atmosphere. How much of what we have seen in the post 2007 era is due to volume loss and thinning, and how much is due to the new AD pattern? Has that pattern been maintaining the low extents/areas of the post 2007 years?
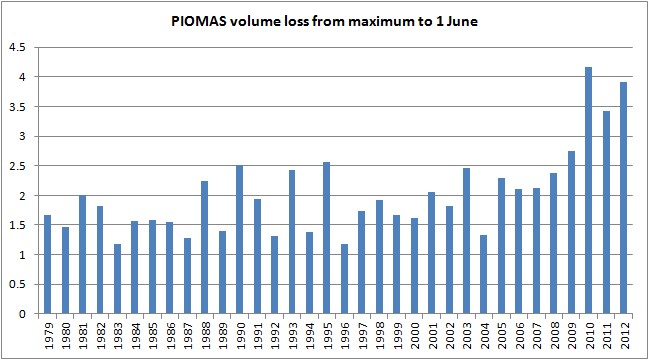
One oddity here is found in looking at changes in CT Area (data) and PIOMAS Volume (data).
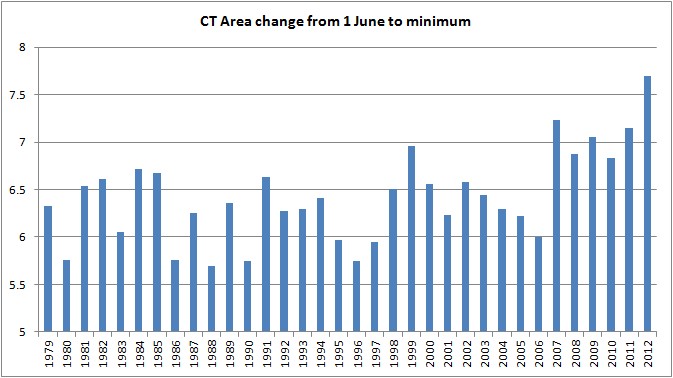
CT Area shows a jump in summer loss post 2007, possibly supporting the finding that the AD has impacted sea ice after 2007. However PIOMAS volume doesn't show such a strong increase in volume loss during summer.
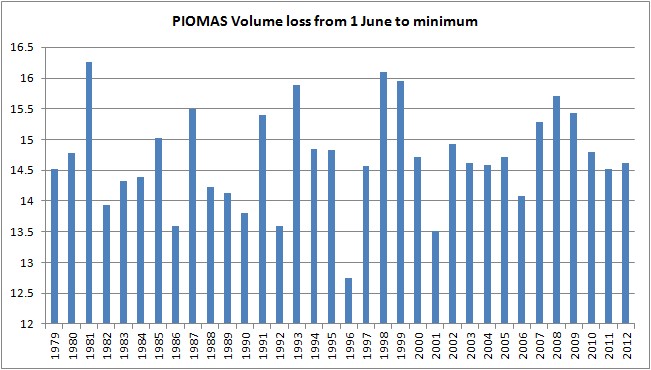
There is an initial increase in volume loss over the summer, but after 2010 this loss moves to earlier in the year, in line with my earlier posts on the 2010 volume loss.
That PIOMAS shows this behaviour seems to me to be significant because the atmospheric forcing PIOMAS uses is NCEP/NCAR reanalysis, which is what Overland et al use. On the issue of the difference between the implications of PIOMAS and the US Navy Postgraduate School model volume losses, as opposed to GCMs, both of the former models assimilate current atmospheric data. Overland et al note that GCMs may not be capable of producing the sort of factors that have lead to the 2007 shift in circulation. Thus assimilation of real world atmospheric forcing on ice may be another reason why the assimilating models suggest a more rapid transition that GCMs.
Is the new AD pattern itself due to ice loss? In the case of this question it seems that if this is the case the situation is far from simple and any feedbacks are not as simple as, for example, reduced sea ice -> direct atmospheric impacts (low level warming, latent heat etc) -> changes in the atmosphere.
An aspect of the Overland et al paper that I've not touched on is the issue of wider impacts. From my previous posts on this new AD pattern I'm confident that there is one clear impact, wetter summers for the UK. However looking at the pressure and GPH anomalies other impacts are less strong and may be mediated by other atmospheric patterns, confusing the picture. Nonetheless Overland et al do put forward some suggestions of feasible links to extreme early summer weather events, such as the 2012 heatwaves in the US and Russia and the Russian heatwave in 2010. Furthermore, as Hanna et al find, the impact of this new pattern on Greenland ice sheet run off is statistically significant, which has implications for Greenland mass balance.
So where does this leave the role for Anthropogenic Global Warming in the loss of Arctic sea ice? Really it doesn't change the main issue, human activities, largely CO2 emissions are warming the planet and that is driving Arctic change. The long term agreement between CO2 emissions, temperature, and the loss of sea ice remains, more here. What this change in the atmosphere may do is explain some of the acceleration of sea ice loss during the last ten years. Here is a scatter plot of CT Area daily minimum area (M km^2) versus GISS Land Ocean Temperature for north of 64 deg N (deg C).

Whilst the relationship between temperature and ice area is clear, the offset to the left (drop in area) post 2007 shows that post 2007 ice area has dropped, independent of the preceding trend. The question that interests me is this: to what degree has the AD caused the drop in area as opposed to sea ice thinning and increased open water formation efficiency?
Once again, thanks to Dr Francis for sight of this paper and useful discussion about this paper and the 2010 PIOMAS volume loss. This does not imply that my musings are supported by any of the scientists mentioned in this post.
Bluthgen et al, 2012, "Atmospheric response to the extreme Arctic sea ice conditions in 2007"
Abstract.
Hanna et al, 2012, "The influence of North Atlantic atmospheric and oceanic forcing effects on 1900–2010 Greenland summer climate and ice melt/runoff."
Abstract.
Overland et al, 2012, "The Recent Shift in Early Summer Arctic Atmospheric Circulation."
GRL, in press.
2 comments:
HGH,
Feel free to post again without the implied advertising of, and links to, your product.
Hi,
should we not now be in the time to observe a potential rerun of the atmospheric consequences of 2007? We had an even larger extent of open seas. We had maybe somewhat less warm SST. So right at about this time the enhanced heat dump into the atmosphere that Bluthgen et al mention should be happening. What does it do - compared to climatology? The Bluthgen et al paper says that consequences can´t be (could not be in 2007) followed through the winter. How will it be this time? If they are rigth don´t they implicitly say that the atmosphere doesnt have a memory of a monster minimum into the next year? And is that not in agreement with your retelling of the Overland et al suggestion that it is snow cover changes (not ice changes) that drive the atmospheric change? Is this too simpleton thinking?
Post a Comment