So what has been going on? Two papers published in 2011 provide a broadly coherent picture. Kaufman et al examined the issue of temperature changes from 1998 to 2008. They found that emissions of sulphates aerosols (China's coal consumption playing a dominant role) offset most of the forcing from rising greenhouse gas emissions with dominance of La Nina ENSO phase and reduced insolation due to the solar cycle explain the lack of warming over that period. In contrast Foster and Rahmstorf consider the longer period 1979 to 2010 and find that over that whole period ENSO and volcanic forcing (stratospheric aerosols from Plinean eruptions) contribute the most with a lesser contribution from reduced solar insolation. Once these factors are allowed for Foster & Rahmstorf find that the signature of global warming is clear and unabated over that period. However both Kaufman et al and Foster & Rahmstorf consider the annual average temperature, there is new research that shows and explains a regional seasonal signal of devatiation from the pattern of global warming.
I've recently posted on research by Drs Judah Cohen & Justin Jones in which the Arctic Oscillation (AO) is shown not be a chaotic, and hence unpredictable, process, but is shown to be linked to changes in Eurasian snowfall. As a result of that post Dr Cohen was kind enough to direct me to his publications page at which there is a pre-print of a paper due to be published. This paper offers some plausible answers to the questions I had in my previous post. The paper concerned is "Arctic warming, increasing snow cover and widespread boreal winter cooling." I'll refer to it as Cohen et al. The boreal cooling referred to in the title can be seen using GISS Maps although in the study CRUTEM3 is used. The cooling area is from Europe across Eurasia, and from the Eastern coast of the US towards southern Alaska.
GISS Maps plot of Dec/Jan/Feb temperature change 1988 - 2010.
As is noted in Cohen et al, this pattern is contrary to the trends predicted by models. So what is going on? I've previously discussed the link between cold winters and Arctic sea-ice, and Cohen & Jones 2011 caused me to doubt this because of the strong linkage demonstrated between the AO and Eurasian snowfall. I have a similar problem with solar forcing of cold winters, even though that still seems to me connected with increased Arctic sea-ice during the Little Ice Age. Cohen et al (figure 4) note that there is a closer resemblance between regressions of previous October Eurasian snow cover and AO index with temperature than between temperature and the preceding September sea-ice extent. I agree with Cohen et al, this shows that the primary linkage is one between Eurasian snowfall and the AO, not between sea-ice and the AO.
However figure 2 of Cohen et al suggests that there is in actuality a causal role for the reduction of Arctic sea-ice.
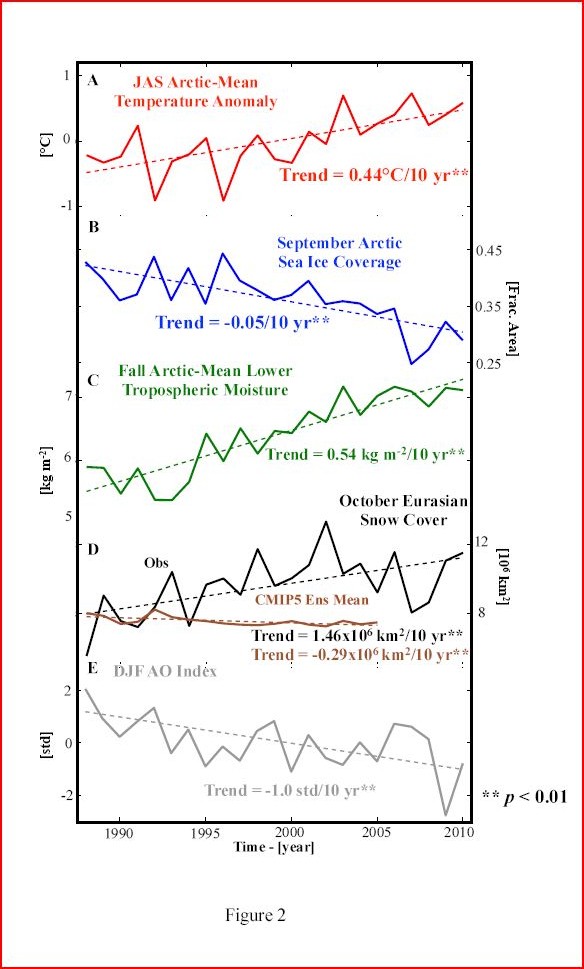
Figure 2 of Cohen et al.
In short (read the paper for more details), the process outlined in figure 2 and associated text is as follows:
A) Arctic Temperature increase - There's bit of feedback here as sea-ice loss is a large part of Arctic amplification.
B) As a result of the warming sea-ice declines in volume leading to a decline in September sea-ice extent.
C) Increase in mean lower tropospheric moisture. As the atmosphere warms the Clausius Clapyron relationship allows for a higher level of water vapour to be held in the warmer air. Also increased amounts of open water in the Arctic provide more water vapour as there's more open ocean for evaporation to take place from.
D) The increased atmospheric humidity allows for an increase in October Eurasian snow cover.
E) The increased October Eurasian snow cover causes a decrease in the December/January/February AO index. This then leads to the observed cooling pattern in late winter Northern Hemisphere.
In my previous post I had been unable to see a trend in the Rutger's Snowlab Eurasian snow cover data, i.e. here. So I hadn't been convinced by this reasoning when I wrote the post. However I had been looking at the whole of the dataset, not just the last two decades, and looking at the last two decades alone seems reasonable to me as these cover the period of the most radical changes in Arctic sea-ice cover. Taking into account figure 2 and associated text I think this is a reasonable causal linkage between the changes in Arctic sea-ice, the AO, and cold boreal winters.
One final issue to point out is the apparent disagreement between the CMIP5 ensemble mean and observed Eurasian snow cover. Taking the mean of an ensemble of climate model runs averages out differences (weather) between individual model runs. I don't see this as a problem in and of itself because other research I've discussed shows that the changes in the Arctic are due to a forced response (e.g. Johanessen et al), not internal variability, so the ensemble mean should still show the signal of snowfall changes if they are part of the forced response (i.e. the forced response is common to all ensemble members). That the ensemble mean doesn't contain the signal of Eurasian snowfall increase could be taken to mean that the snowfall signal is due to internal variability. However in view of the chain of cause and effect suggested by figure 2, associated text and references, I think this is unlikely to be the correct interpretation, the better interpretation being that the failure to reproduce the warming is a problem in the models.
I find Cohen et al quite convincing, but I can't leave this issue without touching on some more research. Dr Jennifer Francis and colleagues have done research which I've touched upon in my post on the cold winters - Arctic linkage post. That still stands; there is a relationship between reduced Arctic sea-ice in the autumn and reduced geopotential height thickness in the Pacific and Atlantic basins during the following Winter. In the comments on the previous post Kevin O'Neill was kind enough to direct me to a post by Jeff Masters about new research by Dr Francis. I can recommend reading it, but in short, to quote from the start of Master's post:
"The question is not whether sea ice loss is affecting the large-scale atmospheric circulation...it's how can it not?" That was the take-home message from Dr. Jennifer Francis of Rutgers University, in her talk "Does Arctic Amplification Fuel Extreme Weather in Mid-Latitudes?", presented at last week's American Geophysical Union meeting in San Francisco....
... High-amplitude loops in the upper level wind pattern (and associated jet stream) increases the probability of persistent weather patterns in the Northern Hemisphere, potentially leading to extreme weather due to longer-duration cold spells, snow events, heat waves, flooding events, and drought conditions.
Despite Dr Cohen's research regarding winter I'm still convinced we should be starting to see wider direct impacts from the changes in the Arctic atmosphere. Firstly even though Cohen and colleagues make a good case that Northern Hemisphere cold winters are being increased due to the Arctic, that doesn't mean other factors aren't at play. In addition my agreement with Jeff Master's quote above (i.e. 'how can it not') is in part because of the papers I've read, even though I now am unconvinced by Dr Overland's arguments, and in part because of what I've seen from NCEP/NCAR. Although on reflection there's probably a part of simple reasoning from rotating pan experiments, and simple 'common sense' reasoning can lead to all sorts of daftness.
And what of the models? They seem to be missing some important things! The question is not: 'Are the models right?' because all models are wrong; the map is never the territory. The question is: 'Are the models useful?' Yes we will see a continuation of global warming, with fluctuations around the trend due to exogenous factors, as the models suggest and as Kaufman et al and Foster and Rahmstorf show. But we will also see significant surprises and as Cohen et al shows some of these surprises may actually be connected with the process of global warming.
Bitz & Roe, 2004, "A Mechanism for the High Rate of Sea Ice Thinning in the Arctic Ocean."
http://www.atmos.washington.edu/~bitz/Bitz_and_Roe_2004.pdf
Cohen et al, pre-print, "Arctic warming, increasing snow cover and widespread boreal winter cooling."
http://web.mit.edu/jlcohen/www/papers/Cohenetal_ERL12.pdf
Foster & Rahmstorf, 2011, "Global temperature evolution 1979–2010."
http://sciences.blogs.liberation.fr/files/rahmstorf-vraies-temp%C3%A9ratures.pdf
Johanessen et al, 2004, "Arctic climate change: observed and modelled temperature and sea-ice variability."
Kaufman et al, 2011, "Reconciling anthropogenic climate change with observed temperature 1998–2008."
http://www.pnas.org/content/early/2011/06/27/1102467108
7 comments:
Chris, well thought out (as always) and a good synopsis of my own conclusions. I actually find it a bit disconcerting that we more often than not arrive at the same understanding. Despite our disparate backgrounds, experiences, and (I suspect) views on other topics; when we read climate science articles we come away holding onto the same nuggets of information and synthesize them similarly.
I can't remember if you've touched on Arctic methane here or not, but when/if you consider the topic you might want to read Vasilii Petrenko. I found his letter to Science Magazine; pp1146 regarding previous research by Shakhova to be enlightening. Petrenko's paper on the last large methane 'burp' is also worth reading (and short!).
Hope you're felling better and enjoyed the Holidays.
Thanks Kevin,
Hope you enjoyed the holidays too.
I think that the evidence forces the conclusions. I've recently spent (wasted) some time over at YouTube - The dregs of the denialist fringe seem to congregate over there. If you ever want to see what belief vs evidence looks like that's the place to go, but it's not pretty. ;)
Thanks for those resources, after the next couple of posts I'm going to put everything else aside and seriously look at methane - not done that on this blog.
I'm glad you mentioned your blog over at Neven's; I hadn't come across it before. Awesome work, just great. I'm going to add a link here from the post inspired by your comment at Neven's.
Hi Tracker,
I've never come across your blog either. Will give it a read when I have some time, although I did read your post on Arctic tipping points - interesting.
I'm just having a break from ploughing through the Eisenman 2011 paper on just that subject and have a post on Abbot/Tzipperman that I'll be posting as soon as I've got a better handle on the 2011 paper. Although this subject is really pushing me to the envelope of my competence.
Hi!
I dont understand how is it possible that in your GISS Maps plot of Dec/Jan/Feb temperature change 1988 - 2010 temperatures show cooling in large parts of Europe and Asia. In reality they have been rising steadily. I´m living in Finland and winters from year 1988 until now have been exceptionally mild and mildest winters we have seen were in latest decade. Only two recent winters 2008/9 and 2010/2011 were normal or slightly cooler than average. Still in your GISS map our winters seems to be cooling 2 degrees celcius. That simply isn't correct. Or am i missing something now?
Yours OJ
Ups. I meant to write that winters 2009/2010 and 2010/2011 were slightly cooler than average, not the winter 2008/9, which was actually rather mild. And mildest winter we have recorded here,2007/2008 wasn´t a winter at all because in our standards winter begins when temperature drops below zero celsius 7 days in a row. In that winter we didn´t have a single month with average temperature below zero. and our records begin from
Chears!
OJ
Hi OJ,
Yes in your area it's a cooling of 1 to 2 degC over that period.
If you take GISS Maps anomaly, the anomaly being the deviation from the baseline average (1951 to 1980) then over The Baltic the anomaly for 1988-1998 is significantly warmer than for 2000 to 2010. Give those links about 5 seconds to work.
Both periods have warmed since 1951-1980, but since 1988 there's actually been a slight cooling - enough to wipe out any further warming trend.
It did come as a surprise to me when I first started reading Cohen's work, here in the UK winters have been mild, so I checked GISS and NCEP/NCAR and there the pattern was! I included the GISS Maps plot to give 'independent corroboration' to this assuming it might be questioned.
Post a Comment