To melt a given volume of ice requires a certain amount of energy, this is the enthalpy of fusion, 334kj/kg. So the volume anomaly can be transformed into an energy anomaly, in this post I call this the implied energy anomaly: it's the energy anomaly implied by the volume anomaly.
To calculate the energy anomaly I've used density from Alexandrov et al 2010. The current PIOMAS series is based upon an analysis by Schweiger et al, they use a single density for ice of 928kg/m^3. However Alexandrov et al, which is a paper contributing to the Cryosat mission gives different densities for first-year and multi-year sea-ice. As I've posted previously, the evidence shows that the Arctic ice pack has transitioned from a mainly multi-year to a mainly first-year pack, so I consider it reasonable to account for this change.
Alexandrov et al give typical densities for first-year and multi-year ice as 916.7 kg/m^3 and 882 kg/m^3 respectively. Lacking a publicly available series, I've also used table 1 of Maslanik et al 2011 to make a timeseries of multi-year ice extent, first year ice extent is then calculated by subtracting multi-year extent from the average annual extent as calculated from the NISDC monthly sea-ice extent data.
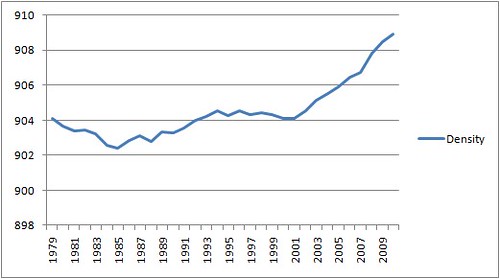
Fig 1. Calculated density of sea-ice (kj/kg).
The changing regimes of the above graph merely reflect the 4 regimes outlined in Maslanik 2011 table 1, and associated text. Accounting for the changes in first-year and multi-year sea-ice may not be strictly necessary in view of the wider uncertainties in the data used, especially PIOMAS. However it does reveal that there has been an upward tendency in density due to the transition to a predominantly first-year sea-ice pack.
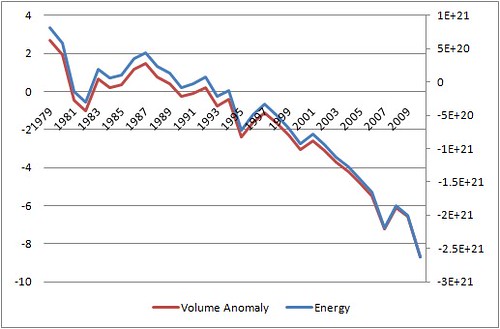
Fig 2. PIOMAS volume (1000km^3 - left) and calculated implied energy (joules - right).
Obviously the energy anomalies generally track the volume anomalies, as those are the greatest factor. But it can be seen that the two curves generally track until the 21st century, where the increase in density due to the transition to first-year predominance begins to increase the energy anomaly.
The following graph shows that the most recent (2010) annual energy anomaly is around half the annual range. The annual range has been calculated by taking the maximum from the minimum volume for each year and calculating the implied energy anomaly using the adjusted density, as outlined above.
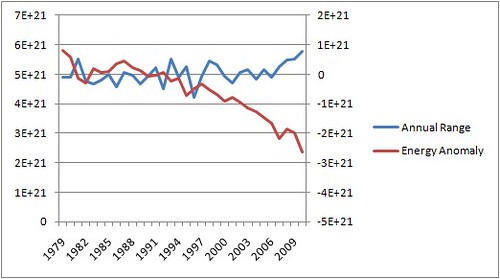
Fig 3. Implied energy of volume anomaly and annual volume range (joules).
I've used extent not area because I have an extent series from 2003 courtesy of IARC-JAXA. Combining this with PIOMAS volume gives an indication of thickness since 2003.
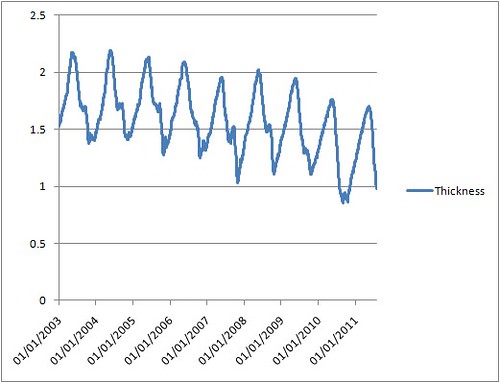
Fig 4. Calculated thickness (metres), using PIOMAS volume and IARC-JAXA extent, calculated on a daily basis.
It should be borne in mind that as extent covers ice concentrations down to 15% and AMSRE shows a lot of low concentration ice in substantial peripheral areas at the minima; this is something of a clumsy tool. However as PIOMAS seems to be producing reasonable indication of volume trends it is possible to have some confidence in the qualitative message that this is providing. Furthermore, from what information is available, the calculated thicknesses seem reasonable, e.g. the Alfred Wegener Institute flights (i.e. Science Daily) & Polarstern.
The question now arises: There has been a marked drop in volume as reported by PIOMAS in 2010 and 2011, when is this loss of volume occurring? By calculating the average volume for each day using the baseline period 1979 to 1998 it's possible to calculate daily anomalies. Most recently it is clear that in 2010 and 2011 the greatest volume losses have been between April and June. 2009 and 2008 also have early season losses, but with significant losses in the latter part of the melt season.
 ?)
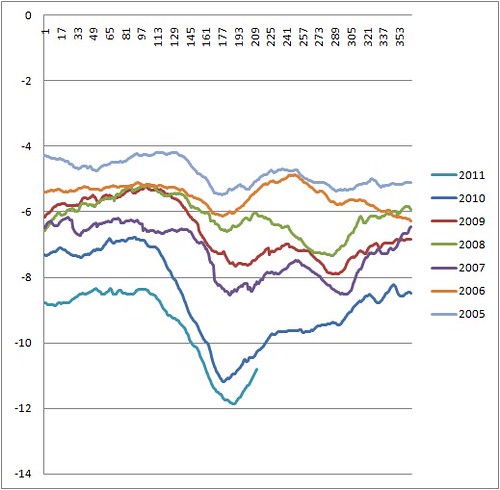
Fig 5. PIOMAS Volume (1000km^3) anomaly series 2005 to 2011.
This suggests that the recent acceleration of volume loss shown by PIOMAS is not due to ice-ocean albedo feedback, as it's happening in the part of the season where there's less open water in the Arctic, as opposed to late summer when there is.
Note that if you follow the series along from one year to the next you find that in some years the end value of the preceding year does not tie in with the start value of the following year. This is because the 1979-1998 average for day 1 is 23.21885, whereas the average for day 365 is 22.835, this is the biggest change in the series of daily averages. I am unable to further explain this odd finding, but it does not substantially affect any of the results presented here.
Below is a graph of the IARC-JAXA extent anomaly years following 2007, I've not included the earlier years as it's hard enough to read as it is.
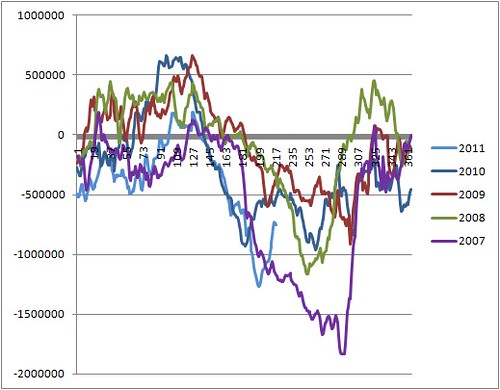
Fig 6. IARC-JAXA annual extent (km^2) anomaly 2007 to 2010.
It's apparent that there is a significant drop in extent anomaly in April to June 2010 and 2011 at the same time as PIOMAS shows the substantial volume loss. This suggests that the recent volume loss may be associated with the extent anomaly and whatever is causing that. Although 2007's extent loss over the same period, and afterwards, suggests the issue could be more complex, as the 2007 volume anomaly doesn't drop in line with extent.
I'd like to have a conclusion to this, but having sat on this work since early this month the matter is still unresolved. In particular I can't figure out why there is the issue with day 1 and day 365 averages. It's clear even from comparison of PIOMAS volume anomaly and annual cycle that the current energy anomaly is around half the annual cycle. This alone I find quite staggering. It suggests a substantial gain in energy since only the late 1990s. As for the finding that the recent (2010/2011) apparent acceleration of PIOMAS volume anomaly is due to loss during April to June, I don't know what to make of it. NSIDC Sea-Ice news mentions warm temperatures during those periods, but it does so at other times of the year without the same volume losses.
So without proper conclusions I can only claim to be 'playing around' with PIOMAS. Rather than mess around with this stuff further I've decided to post and leave it to readers to decide what it means. Opinions will be greatly appreciated.
Alexandrov et al, 2010, "The relation between sea ice thickness and freeboard in the Arctic."
http://www.the-cryosphere.net/4/373/2010/tc-4-373-2010.pdf
IARC-JAXA
http://www.ijis.iarc.uaf.edu/en/home/seaice_extent.htm
NSIDC Monthly extent data: Fetterer, F., K. Knowles, W. Meier, and M. Savoie. 2002, updated 2009. Sea Ice Index. Boulder, CO: National Snow and Ice Data Center. Digital media.
http://nsidc.org/data/
Maslanik et al, 2011, "Distribution and trends in Arctic sea ice age through spring 2011."
PIOMAS.
Schweiger et al, 2011, "Uncertainty in Modeled Arctic Sea Ice Volume."
http://psc.apl.washington.edu/wordpress/wp-content/uploads/schweiger/pubs/IceVolume-2011-06-02-accepted-with-figures.pdf
9 comments:
IIRC the buoy data shows growing thickness until May. If there really is an anomaly the reason may be below the ice. Can you exclude regional changes to the halocline caused by blobs of warm and salty Atlantic water?
What is interesting, is that in the last years, the volume anomaly drop occurs mainly about between day 120 and 180, that is in the first half of the melting period. (You mentioned that briefly.) I think you are right to rule out the albedo feedback as principal cause for the anomaly drop. Remain ocean current, ocean layer mixing (as suggested in previous post), air current and insolation changes as possible culprits - or a combinatin of them. The last two would point to a change in the weather system. Unfortunately I don't know enough to point my finger on any of those villains.
Hello Arctio,
No I don't have regional data. I was thinking of the recent graphic of sea-ice bouy data on 16/8/11 NSIDC Sea Ice News, here. Something like that for April-June would help.
I suspect that an AD index in addition to NOAA's AO, NAO and PNA would at help.
Hello Dlen,
I wouldn't rule out albedo feedback totally, in addition to ice/ocean there is the issue of wet vs dry ice, which would be more relevant at that time of year. I suspect weather, although as I've implied in the post there doesn't seem to be anything unique about the last 2 year's April-June period.
I'll try to get the time to go through NCEP/NCAR renalysis and see if there's anything there.
So you can see what I mean about weather here's the last 4 years NCEP/NCAR temperature and sea level pressure.
link
I've never linked to a set on my Flickr account - so if there's a problem please let me know and I'll try something else.
No discernible pattern. Which confirms my memory. I've included the temperature climatology to give an idea of how close to (far from) freezing these are.
Images from here - NCEP/NCAR
The high Arctic doesn't start melting till late in season and the low Arctic starts melting in March (end of). Perhaps low Arctic (below 80N) is becoming disproportionately warmer early in season and high Arctic is more resilient to change.
SimonF
PS I signed in as someone else!
Hello SimonF,
That's why I've included the NCEP/NCAR SLP and surface temperature plots for that period. Warming seems reasonable, but IIRC 2009 had warm temperatures yet the volume loss wasn't as severe as 2010 and 2011.
It's still a puzzle.
What is interesting is regards the annual range.
For the period 1979 to 2006 the annual range average is 16.418, with upper and lower sigma bounds of 17.425 and 15.411.
For the years 2007 to 2010 the range goes up,
2007 17.407
2008 18.087
2009 18.189
2010 18.974
Obviously 2007's range is from March and September of that year, so technically only the September 2007 is after the crash. However 2008 - 2010 show a substantial increase in annual range driven by low summer volume minima.
Chris, I've downloaded, but not opened the volume data files - they've been on my computer for a month. Does that mean there's still hope I can kick this ice obsession?
:)
I'm not sure how easy it would be to quantify, but Rampal's work on ice mechanics and kinematics - specifically ocean wave energy transferred to the ice - may explain the energy anomaly increases.
The draft of his paper can be found at: http://web.mit.edu/~rampal/rampal_homepage/Publications_files/Rampal_etal2011.pdf
There's a lot of useful criticism of the IPCC model deficiencies regarding sea ice.
Thanks Kevin,
I've not seen that Rampal paper, looks very interesting. I've bumped it to the top of my reading list - still might be a couple of weeks before I read it. I'm always running well behind on that issue.
If you want a copy of my spreadsheet just email me: chris886222 at btinternet.com
I'll be updating it later this month when time allows and the August PIOMAS figures are out.
Post a Comment