Firstly here are two excellent videos from Greenman AKA Peter Sinclair of Climate Crocks. Part 1 and Part 2. As usual I give links to videos as I've still not figured out how to make the Blogger player window large enough for details. The videos are about the recent weird weather and links to the Arctic, there are interviews with a stack of scientists, and clips from the recent Horizon programme on Global Weirding. Total time is only 20 minutes, they really are a must see.
As an aside, it's interesting that the clips from news and TV are from the BBC, yet most of the scientists and meteorologists interviewed are American. I suspect the media in the US aren't serving their audience a diet of reality.
Over at RealClimate there's a post by Axel Schweiger, Ron Lindsay, and Cecilia Bitz on the use of extrapolations of PIOMAS volume, here. The basic message - such extrapolations aren't of much use. I'm of a similar view, I think the comment that sums up my view on extrapolation is "You might as well draw the Arctic’s horoscope."
Tuesday, 17 April 2012

Tuesday, 10 April 2012
CO2's role in the end of the Last Glacial
A recent paper by Shakun et al may throw new light upon the role of CO2 in the past glacial and interglacial periods. What does it mean, and does it change the situation we face with regards the current era of anthropogenic global warming, driven in large part by human emissions of CO2?
Friday, 6 April 2012
Anticipation...
PIOMAS March volume data is now out, as anticipated the daily anomalies show nothing special with volume tracking close to last year.
The following graph is of daily volume anomalies, I've calculated the average for each day from 1980 to 1999, the value plotted on the graph is the difference from the average. Click on the graph to see the years, the general trend is down, with 2010 and 2011 showing the greatest drops, 2012 so far being the incomplete purple line.

The first indications of whether we'll see another anomalous volume drop this Spring will come early May when the PIOMAS volume data is out for April. Will see see another drop? If we do, what will that mean?
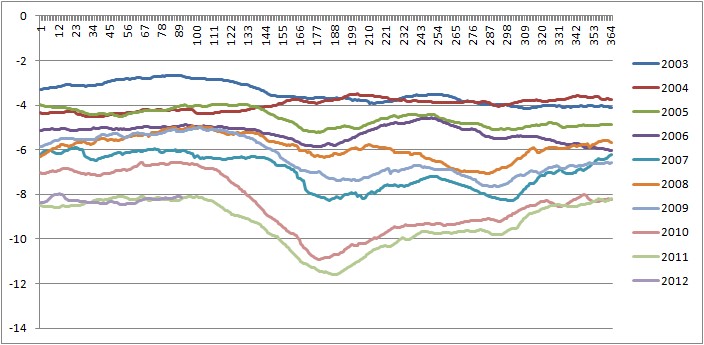
The first indications of whether we'll see another anomalous volume drop this Spring will come early May when the PIOMAS volume data is out for April. Will see see another drop? If we do, what will that mean?
Once is happenstance. Twice is coincidence. The third time it's enemy action.The anticipation is killing me...
Sunday, 1 April 2012
Musings on Models
In 2006, a year before the massive Arctic Crash of 2007, Marika Holland, Cecilia Bitz, and Bruno Tremblay presented a paper entitled "Future abrupt reductions in the summer Arctic sea ice" to Geophysical Research Letters, it was published later the same year. In that paper (Holland et al) an examination of rapid sea-ice loss periods in models used for the IPCC's Fourth Assesment Report was carried out. Holland et al fnd that a general message from the suite of simulations is that the harder humans force the climate, the faster the sea-ice goes, an observation that for readers of this blog may seem trite.
More interesting, especially in the light of the aftermath of 2007 and the clear failure of IPCC models to reproduce the observed rate of ice loss in the Arctic, is whether the models still tell us something of value about the changes we are seeing in the Arctic.
More interesting, especially in the light of the aftermath of 2007 and the clear failure of IPCC models to reproduce the observed rate of ice loss in the Arctic, is whether the models still tell us something of value about the changes we are seeing in the Arctic.
Saturday, 17 March 2012
Mid March Miscellanea.
This is a filler post with a couple of items mainly because I'm too whacked to write much due to work pressures.
Sunday, 11 March 2012
PIOMAS: Calculated thickness.
This post has been partially re-written as I posted an old version and editing would have made it a mess - I had changed my mind about a main conclusion (it is possible to get figures from calculated thickness that reflect real on the ice thickness) after referring to Schweiger et al and doing some more work on my spreadsheet. The portion that I've ended up editing is between the EDIT statements. I decided to pull the post and re-write as at the time I realised the problem only four people had opened this page. Apologies to those four people.
The calculated thickness is a useful metric, it allows some diagnosis of whether PIOMAS volume changes are due to changes in area or thickness, and changes in its annual cycle reflect changes that PIOMAS volume suggests are significant. But can the calculated thickness metric be used to say anything about real thickness on the ice pack?
The calculated thickness is a useful metric, it allows some diagnosis of whether PIOMAS volume changes are due to changes in area or thickness, and changes in its annual cycle reflect changes that PIOMAS volume suggests are significant. But can the calculated thickness metric be used to say anything about real thickness on the ice pack?
Saturday, 10 March 2012
PIOMAS: The Porch and the Roof.
I've previously discussed why I think Spring 2010 saw an event as significant as the Arctic sea-ice crash of 2007. As a result of my last post and the ensuing discussion I am more confident that Spring 2010 was a significant event and that this year, as with 2011, we will see further massive volume losses in the coming Spring. However there are some details that need to be addressed in this post before I go on to look at whether calculated thickness from PIOMAS and extent/area has any value.
Subscribe to:
Posts (Atom)